Last week in our Learning Lab, the second grade team and I planned for a lesson within the data work they are currently doing in Investigations. We spent a lot of time the previous week revisiting the Learning Progressions and the focus by grade level document at Achieve the Core while also discussing the addition work, involving grouping, from their most recent math unit.
Since the students have been doing a lot of work constructing bar graphs, we wanted to move past the polling and construction piece that their unit spends a lot of time on, and make more connections to all of their recent number work.
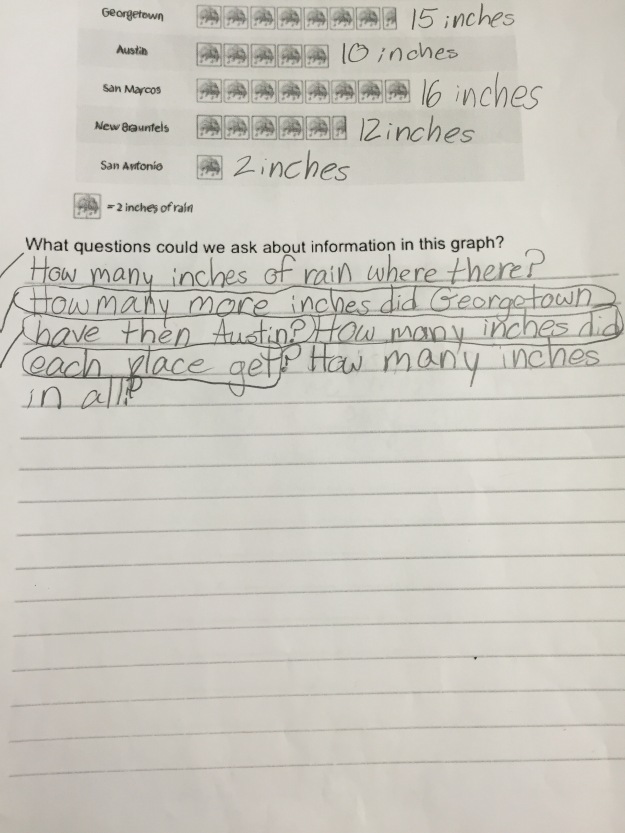
We chose this image to be the focus of the lesson:
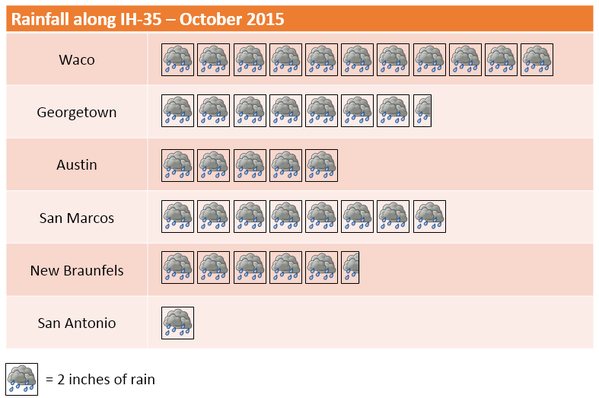
I found this graph on Brian Bushart’s awesome blog
- The rain was in groups of 2 which we thought related really nicely to their most recent addition work.
- The half box was really interesting and we wanted to see how students dealt with it.
- The bars were horizontal as opposed to the vertical bars they have been using in their bar graphs.
- It lent itself to a variety of questions involving comparisons with larger numbers than their classroom graphs they have been doing.
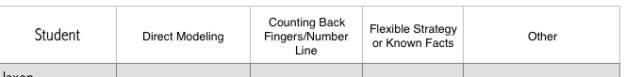
Now, what to do with this image? As we talked about different questions we would want the students to be able to answer about the graph, I threw out the possibility of having students generate the questions after they do some noticing. It was such a fun teacher conversation as we looked at the graph through the eyes of a student and brainstormed questions that could be elicited from the graph. During our brainstorming, we paid careful attention to the type of problem the questions would elicit:
- Join problems involving combining numbers within one bar. This would be a nice connection to the adding by groups they have been working on in class. For example, how much rain did Waco get? Students could count by 2’s or count five boxes as 10.
- Join problems involving multiple bars. For example, how much rain did all of the cities get altogether?
- Comparison problems involving two bars. For example, how much more rain did Austin get than San Antonio?
- Most and least questions. For example, who got the most rain?
- Combination of Join and Compare problems. For example, how much more rain did Georgetown and Waco get than Austin and San Antonio? (This may be a stretch;)
The day of the lesson, Lauren launched the lesson with just me in the room and the other teachers were scheduled to join us during the question-generating time. We thought that would be the most interesting section to see since we only can find coverage for @20 minutes for the teachers.
The students did great noticings in their groups and Lauren and I were feeling really confident that the students could use these noticings to generate questions to match them.


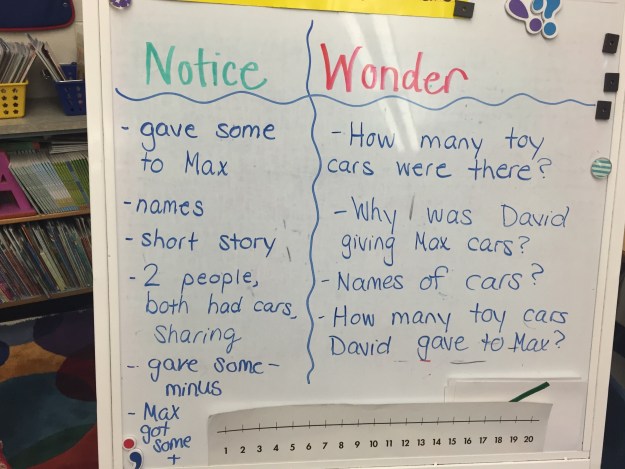
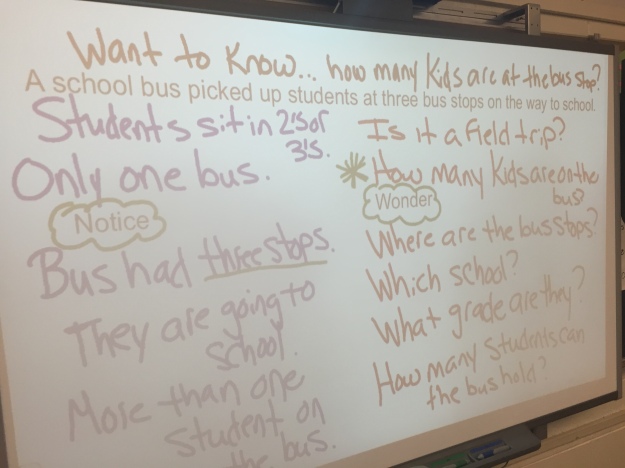
After sharing as a whole group, Lauren prompted the students to begin thinking about what questions they could ask about this graph.
Blank stares.
We were a completely surprised because we though for sure they could work their way backwards from their noticings to create the question that it would answer. At this point we had the entire team of second grade teachers in the room and we began discussing how to clarify the directions. After one teacher prompted the students to think about “question words,” we decided to let them start working in their groups.
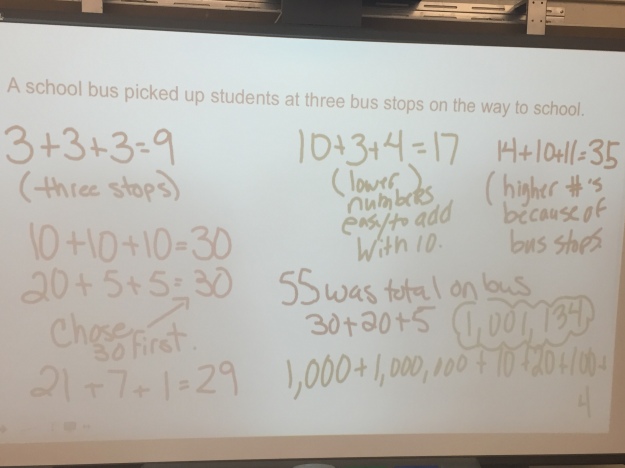
This is the point of the lesson where I realized a component I needed to add to our Learning Lab planning, teacher role during group work. This was our first time having everyone enter during the group work portion of the lesson and while there were great conversations around the room, it was hard to tell how much was students interacting with one another or with the teacher at the table. I think this came about because we could have done better in planning our directions for the students so, as a result, everyone was trying to clarify the directions at the table with the students. In the end, Lauren’s students did finish with a lot of the same questions we anticipated and many questions they could solve the following day:

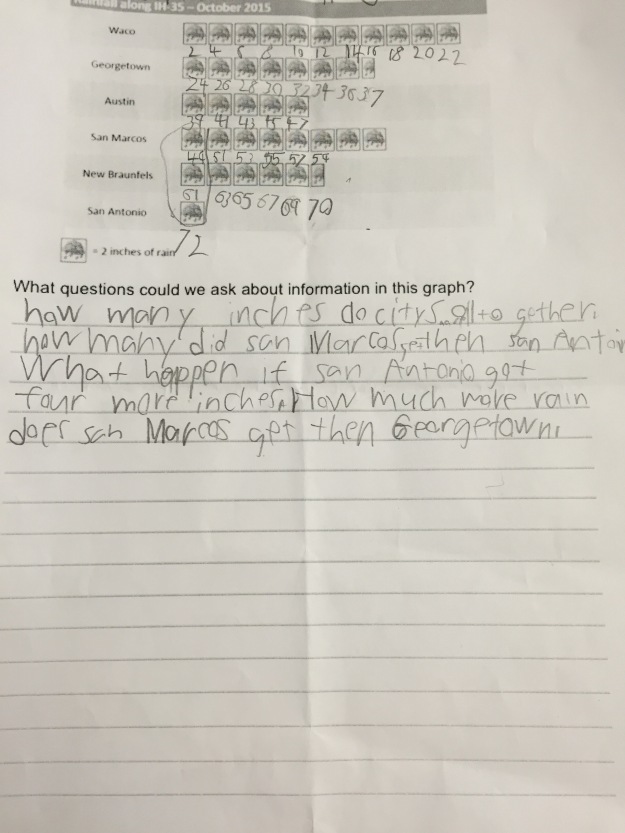

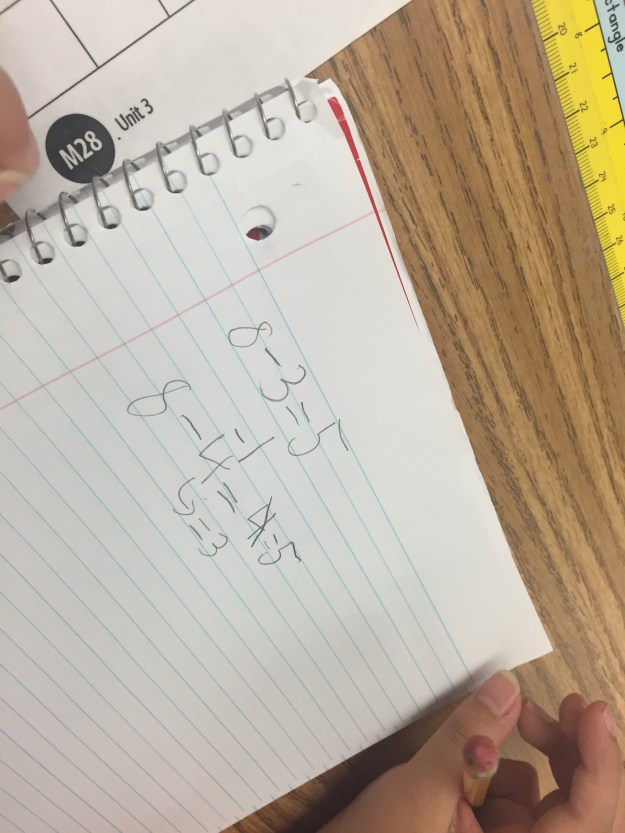
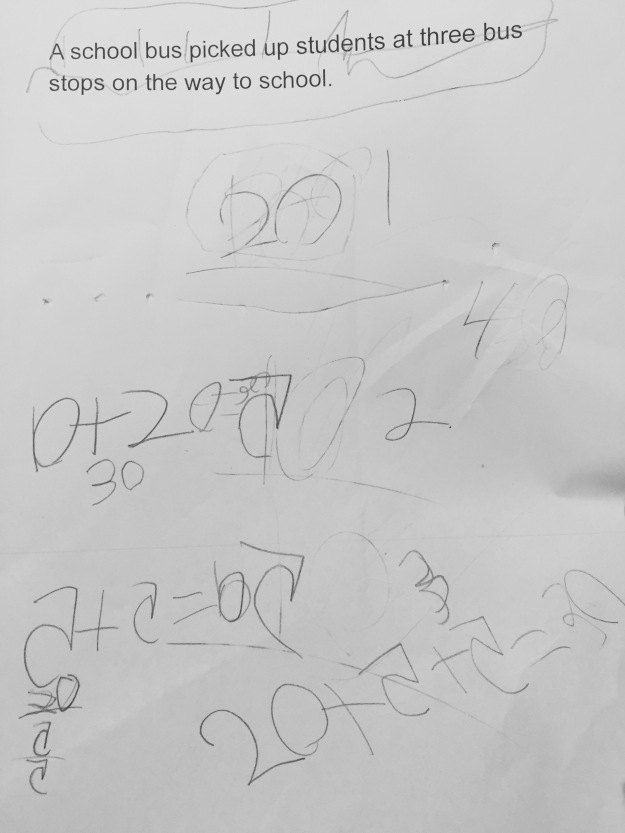
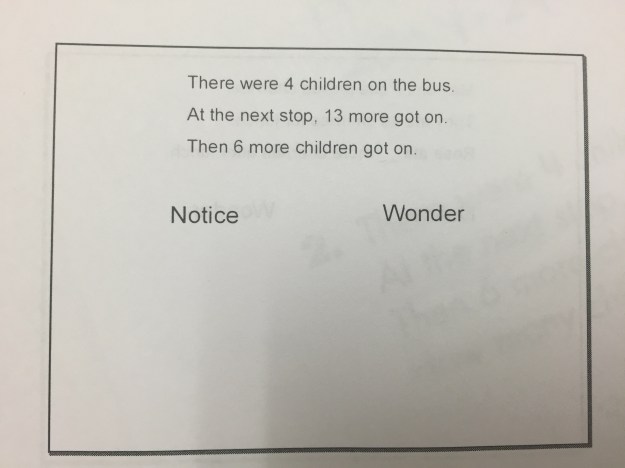
We had planned for students to choose one of their questions and show how they would arrive at their answer in their journal, but the question generating took a bit longer than expected!
Two things I am left wondering:
- In regards to Learning Lab planning, how would we have defined teacher interaction within the groups? Would we just be taking notes on what students were saying/doing? Would be asking students to clarify their thinking? Would we be answering questions they tried to ask us? Should we all be doing the same thing to be consistent in our debrief?
- In regards to the math, how do students work backwards to generate questions for a given image? Would rephrasing the directions help them think about it differently? If we asked them to create a quiz for the teachers based on the graph, would that have helped? How is wondering about an image different than generating questions for it?


")