Last week in our Learning Lab, the second grade team and I planned for a lesson within the data work they are currently doing in Investigations. We spent a lot of time the previous week revisiting the Learning Progressions and the focus by grade level document at Achieve the Core while also discussing the addition work, involving grouping, from their most recent math unit.
Since the students have been doing a lot of work constructing bar graphs, we wanted to move past the polling and construction piece that their unit spends a lot of time on, and make more connections to all of their recent number work.
We chose this image to be the focus of the lesson:
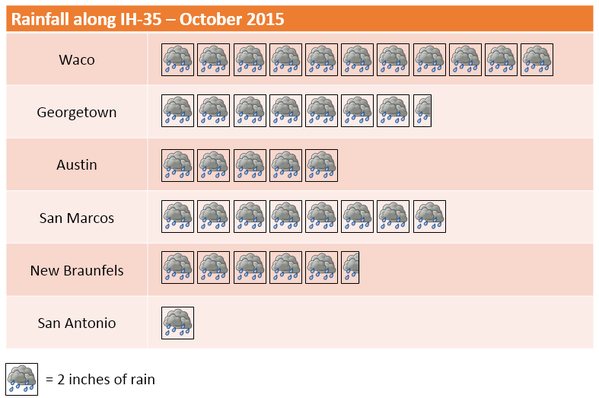
I found this graph on Brian Bushart’s awesome blog
- The rain was in groups of 2 which we thought related really nicely to their most recent addition work.
- The half box was really interesting and we wanted to see how students dealt with it.
- The bars were horizontal as opposed to the vertical bars they have been using in their bar graphs.
- It lent itself to a variety of questions involving comparisons with larger numbers than their classroom graphs they have been doing.
Now, what to do with this image? As we talked about different questions we would want the students to be able to answer about the graph, I threw out the possibility of having students generate the questions after they do some noticing. It was such a fun teacher conversation as we looked at the graph through the eyes of a student and brainstormed questions that could be elicited from the graph. During our brainstorming, we paid careful attention to the type of problem the questions would elicit:
- Join problems involving combining numbers within one bar. This would be a nice connection to the adding by groups they have been working on in class. For example, how much rain did Waco get? Students could count by 2’s or count five boxes as 10.
- Join problems involving multiple bars. For example, how much rain did all of the cities get altogether?
- Comparison problems involving two bars. For example, how much more rain did Austin get than San Antonio?
- Most and least questions. For example, who got the most rain?
- Combination of Join and Compare problems. For example, how much more rain did Georgetown and Waco get than Austin and San Antonio? (This may be a stretch;)
The day of the lesson, Lauren launched the lesson with just me in the room and the other teachers were scheduled to join us during the question-generating time. We thought that would be the most interesting section to see since we only can find coverage for @20 minutes for the teachers.
The students did great noticings in their groups and Lauren and I were feeling really confident that the students could use these noticings to generate questions to match them.


After sharing as a whole group, Lauren prompted the students to begin thinking about what questions they could ask about this graph.
Blank stares.
We were a completely surprised because we though for sure they could work their way backwards from their noticings to create the question that it would answer. At this point we had the entire team of second grade teachers in the room and we began discussing how to clarify the directions. After one teacher prompted the students to think about “question words,” we decided to let them start working in their groups.
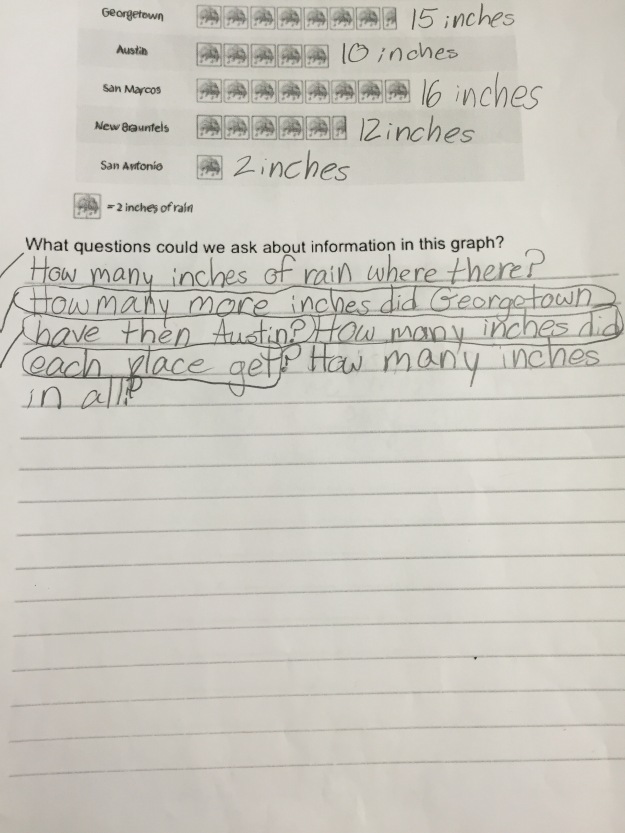
This is the point of the lesson where I realized a component I needed to add to our Learning Lab planning, teacher role during group work. This was our first time having everyone enter during the group work portion of the lesson and while there were great conversations around the room, it was hard to tell how much was students interacting with one another or with the teacher at the table. I think this came about because we could have done better in planning our directions for the students so, as a result, everyone was trying to clarify the directions at the table with the students. In the end, Lauren’s students did finish with a lot of the same questions we anticipated and many questions they could solve the following day:

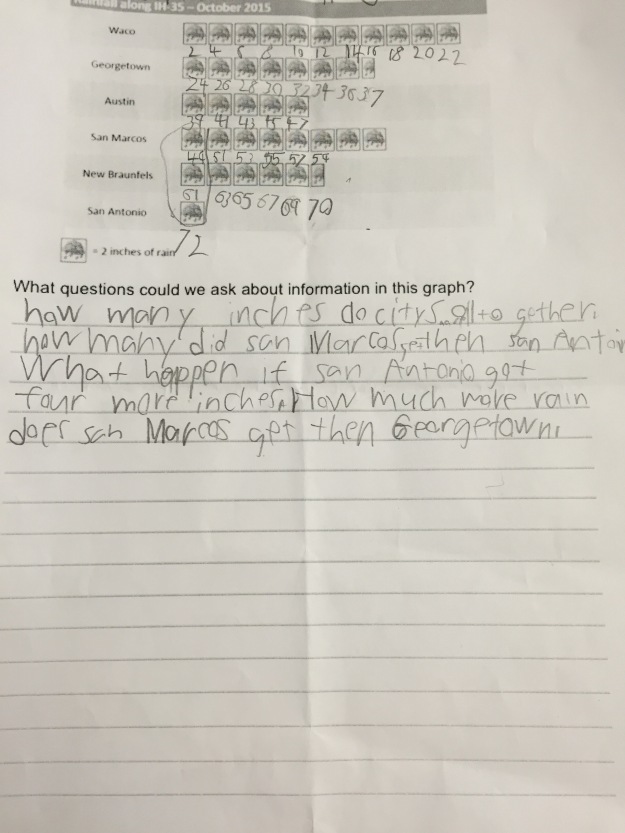

We had planned for students to choose one of their questions and show how they would arrive at their answer in their journal, but the question generating took a bit longer than expected!
Two things I am left wondering:
- In regards to Learning Lab planning, how would we have defined teacher interaction within the groups? Would we just be taking notes on what students were saying/doing? Would be asking students to clarify their thinking? Would we be answering questions they tried to ask us? Should we all be doing the same thing to be consistent in our debrief?
- In regards to the math, how do students work backwards to generate questions for a given image? Would rephrasing the directions help them think about it differently? If we asked them to create a quiz for the teachers based on the graph, would that have helped? How is wondering about an image different than generating questions for it?

This approach of asking learners to construct questions from a graph of data is excellent. That there is a half sized image makes it all the more intriguing. The approach is consistent with Andrew Blair’s amazing website @inquirymaths, though this is focused on learners aged 11+. Pedagogically, causing learners to ask question is learner-centred and is, I believe, a powerful way of deepening learning.
Thank you for sharing this. Regards Mike
LikeLike
It sounds like the questions you were hoping for were different from possible student wondering questions. I have to admit, as a student, I might really be stuck without a clearly question, since the chart seems so clear and self-contained. However, here is something I wonder, prompted by a student question idea:
Does it make sense to add the data for two cities (or more) together? What does the result mean?
For example, Waco got 22 inches of rain, Austin 10 inches, so total 32 inches of rain. Does this mean anything, for example, tell us directly the total volume of water that fell?
Alternatively, what if I split Waco in half, into West Waco and East Waco. Can I deduce how much rain each half got? Would it be 11 inches or 22 inches? My guess is closer to 22 inches for both.
Finally, this leads to another wondering: what are the most appropriate geographic units to use when describing amounts of rainfall? For example, does it make sense to talk about x inches of rain in Texas? Or KY, MA, CT, RI?
LikeLike
We graphed the weather daily when I taught kindergarten and the whichever child lead that portion of calendar had the ask the class a question about the graph. I modeled what that might sound like at first but then the students took that portion over. I thought it was a good activity for them to analyze data and form a question, not to mention the social skills they practiced by leading the group.
I like the purposeful planning that went into choosing this graph to use, (as well as the design of your whole lesson).
LikeLike
This takes me right back to my primary school days… when we had a ‘nature’ table and collected data about the weather each morning by drawing a picture of whether it was sunny, cloudy, overcast or raining… everything you have written above sounds great – this is what education needs to be all about
Regards
MIke
LikeLike
Thinking about your two questions:
In regards to Learning Lab planning, how would we have defined teacher interaction within the groups? Would we just be taking notes on what students were saying/doing? Would be asking students to clarify their thinking? Would we be answering questions they tried to ask us? Should we all be doing the same thing to be consistent in our debrief?
To the first question I offer the following: Teacher interactions are, I believe, about metacognition, of being ‘in the moment’ and making professional decisions about when to intervene and when to stand back At best our interventions deepen learning, at worst they become an interference! I think teacher interventions cannot be planned for and this is what makes teaching organic and so very interesting.
In regards to the math, how do students work backwards to generate questions for a given image? Would rephrasing the directions help them think about it differently? If we asked them to create a quiz for the teachers based on the graph, would that have helped? How is wondering about an image different than generating questions for it?
To your second question: I really like the idea of working backwards from a stimuli to a question. For example: “If the answer is 10 what could the question be?”
I guess there are all kind of ways of causing learners to write questions and “wondering about an image” would, for me, be a precursor to asking questions.
LikeLike
Thank you for this stimulating and very interesting post!
It raises an important question about the relationship between noticing and questioning. Why did the pupils not go on to ask questions after they had noticed features of the bar chart? From my experience of inquiry, I would suggest three possible reasons:
(1) Pupils felt their noticing served to provide ‘answers’. As they had the answers, the pupils were reluctant to go backwards, as they might see it, to generate the questions.
(2) As the chart is clearly labelled, the pupils felt they had fully understood it through their noticing and did not feel the need to ask questions.
(3) More broadly, noticing might act to confirm notions, rather than generate the doubt and speculation that underpin questions.
Curiosity might be generated from a chart that contains less information. Removing the key, for example, might lead to pupils noticing its absence and then asking what each illustration represents. When I run an inquiry, I don’t distinguish between noticing and questioning. I will ask pupils to make an observation or ask a question to initiate inquiry and then probe pupils’ reason for asking a question, which is invariably linked to something they have noticed. Having said that, Brown and Walter in ‘The Art of Problem Posing’ list four distinct phases in their “What-if-not” strategy, which include noticing attributes and, later, posing questions.
Thank you again for the post! The relationship between noticing and questioning should be at the core of every maths lesson.
LikeLike