Category Archives: Measurement and Data

Area Task in 3rd Grade

Since the 3rd graders just wrapped up their unit on area, I thought it was the perfect time to do a task that hit on some really important ideas about area, while also encouraging them to move beyond counting squares. I wanted to see how (or if) students broke apart shapes to find the area, how they used addition and/or multiplication to more efficiently count squares, and if they used any other strategies such as subtracting out blank spaces or decomposing and rearranging pieces to find the area.

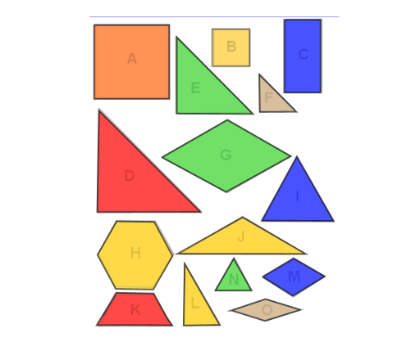
I chose this task from Illustrative Mathematics.

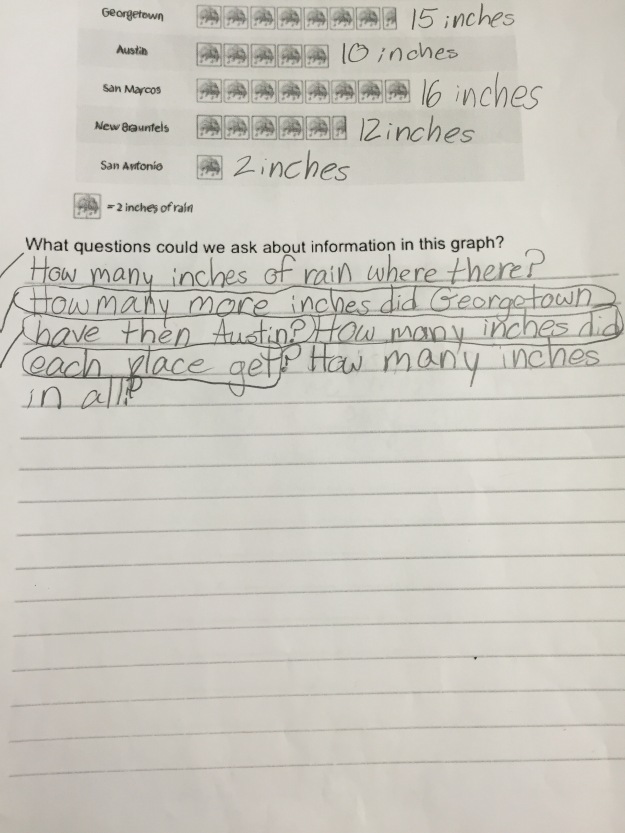
We started with a notice/wonder activity:

img_3878

img_3877

They had so many great wonders that inspired me to think about a follow up activity about other letters, but I will chat about that later.

Since they wondered if the letters all had the same square units and if they were all the same, I used that as the lead into the activity. Even as I was giving directions, however, I saw a majority of them start to count squares by 1. I paused them, told them I was so excited to see they knew counting the squares would get them the area and knew they all could find the correct area that way so we were going to try something different. I asked them to find the area without counting all of the square by 1.

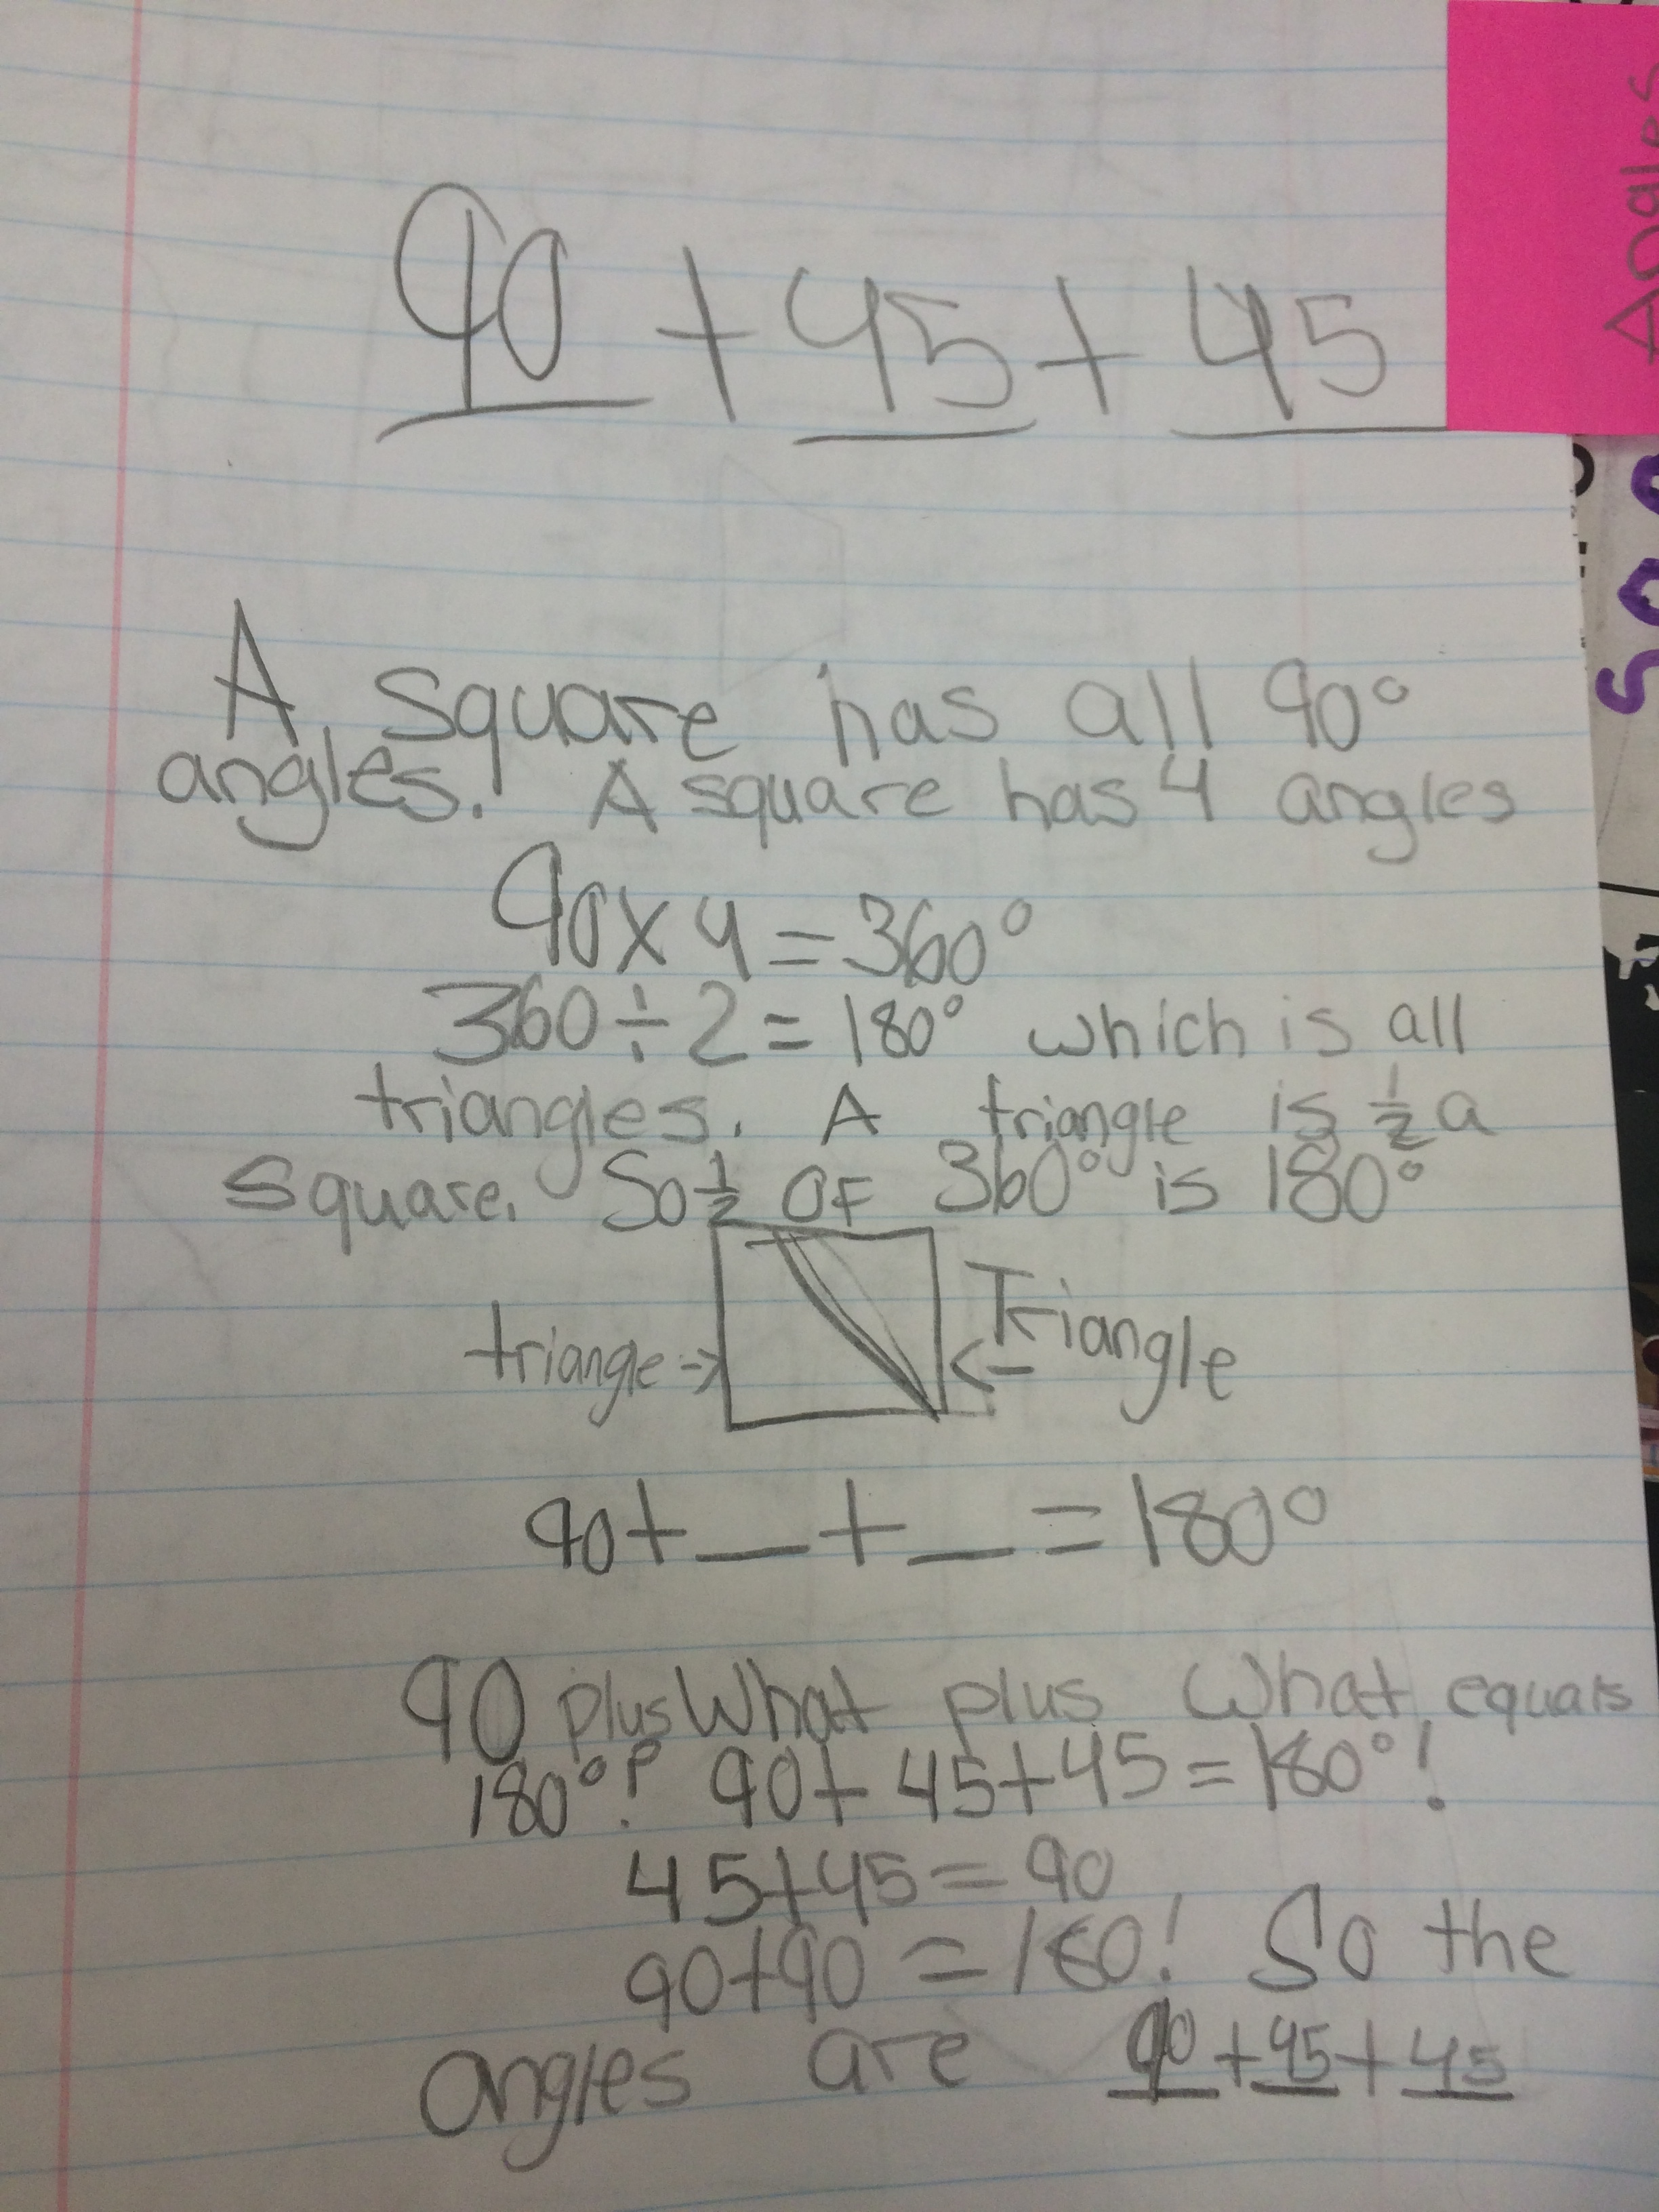
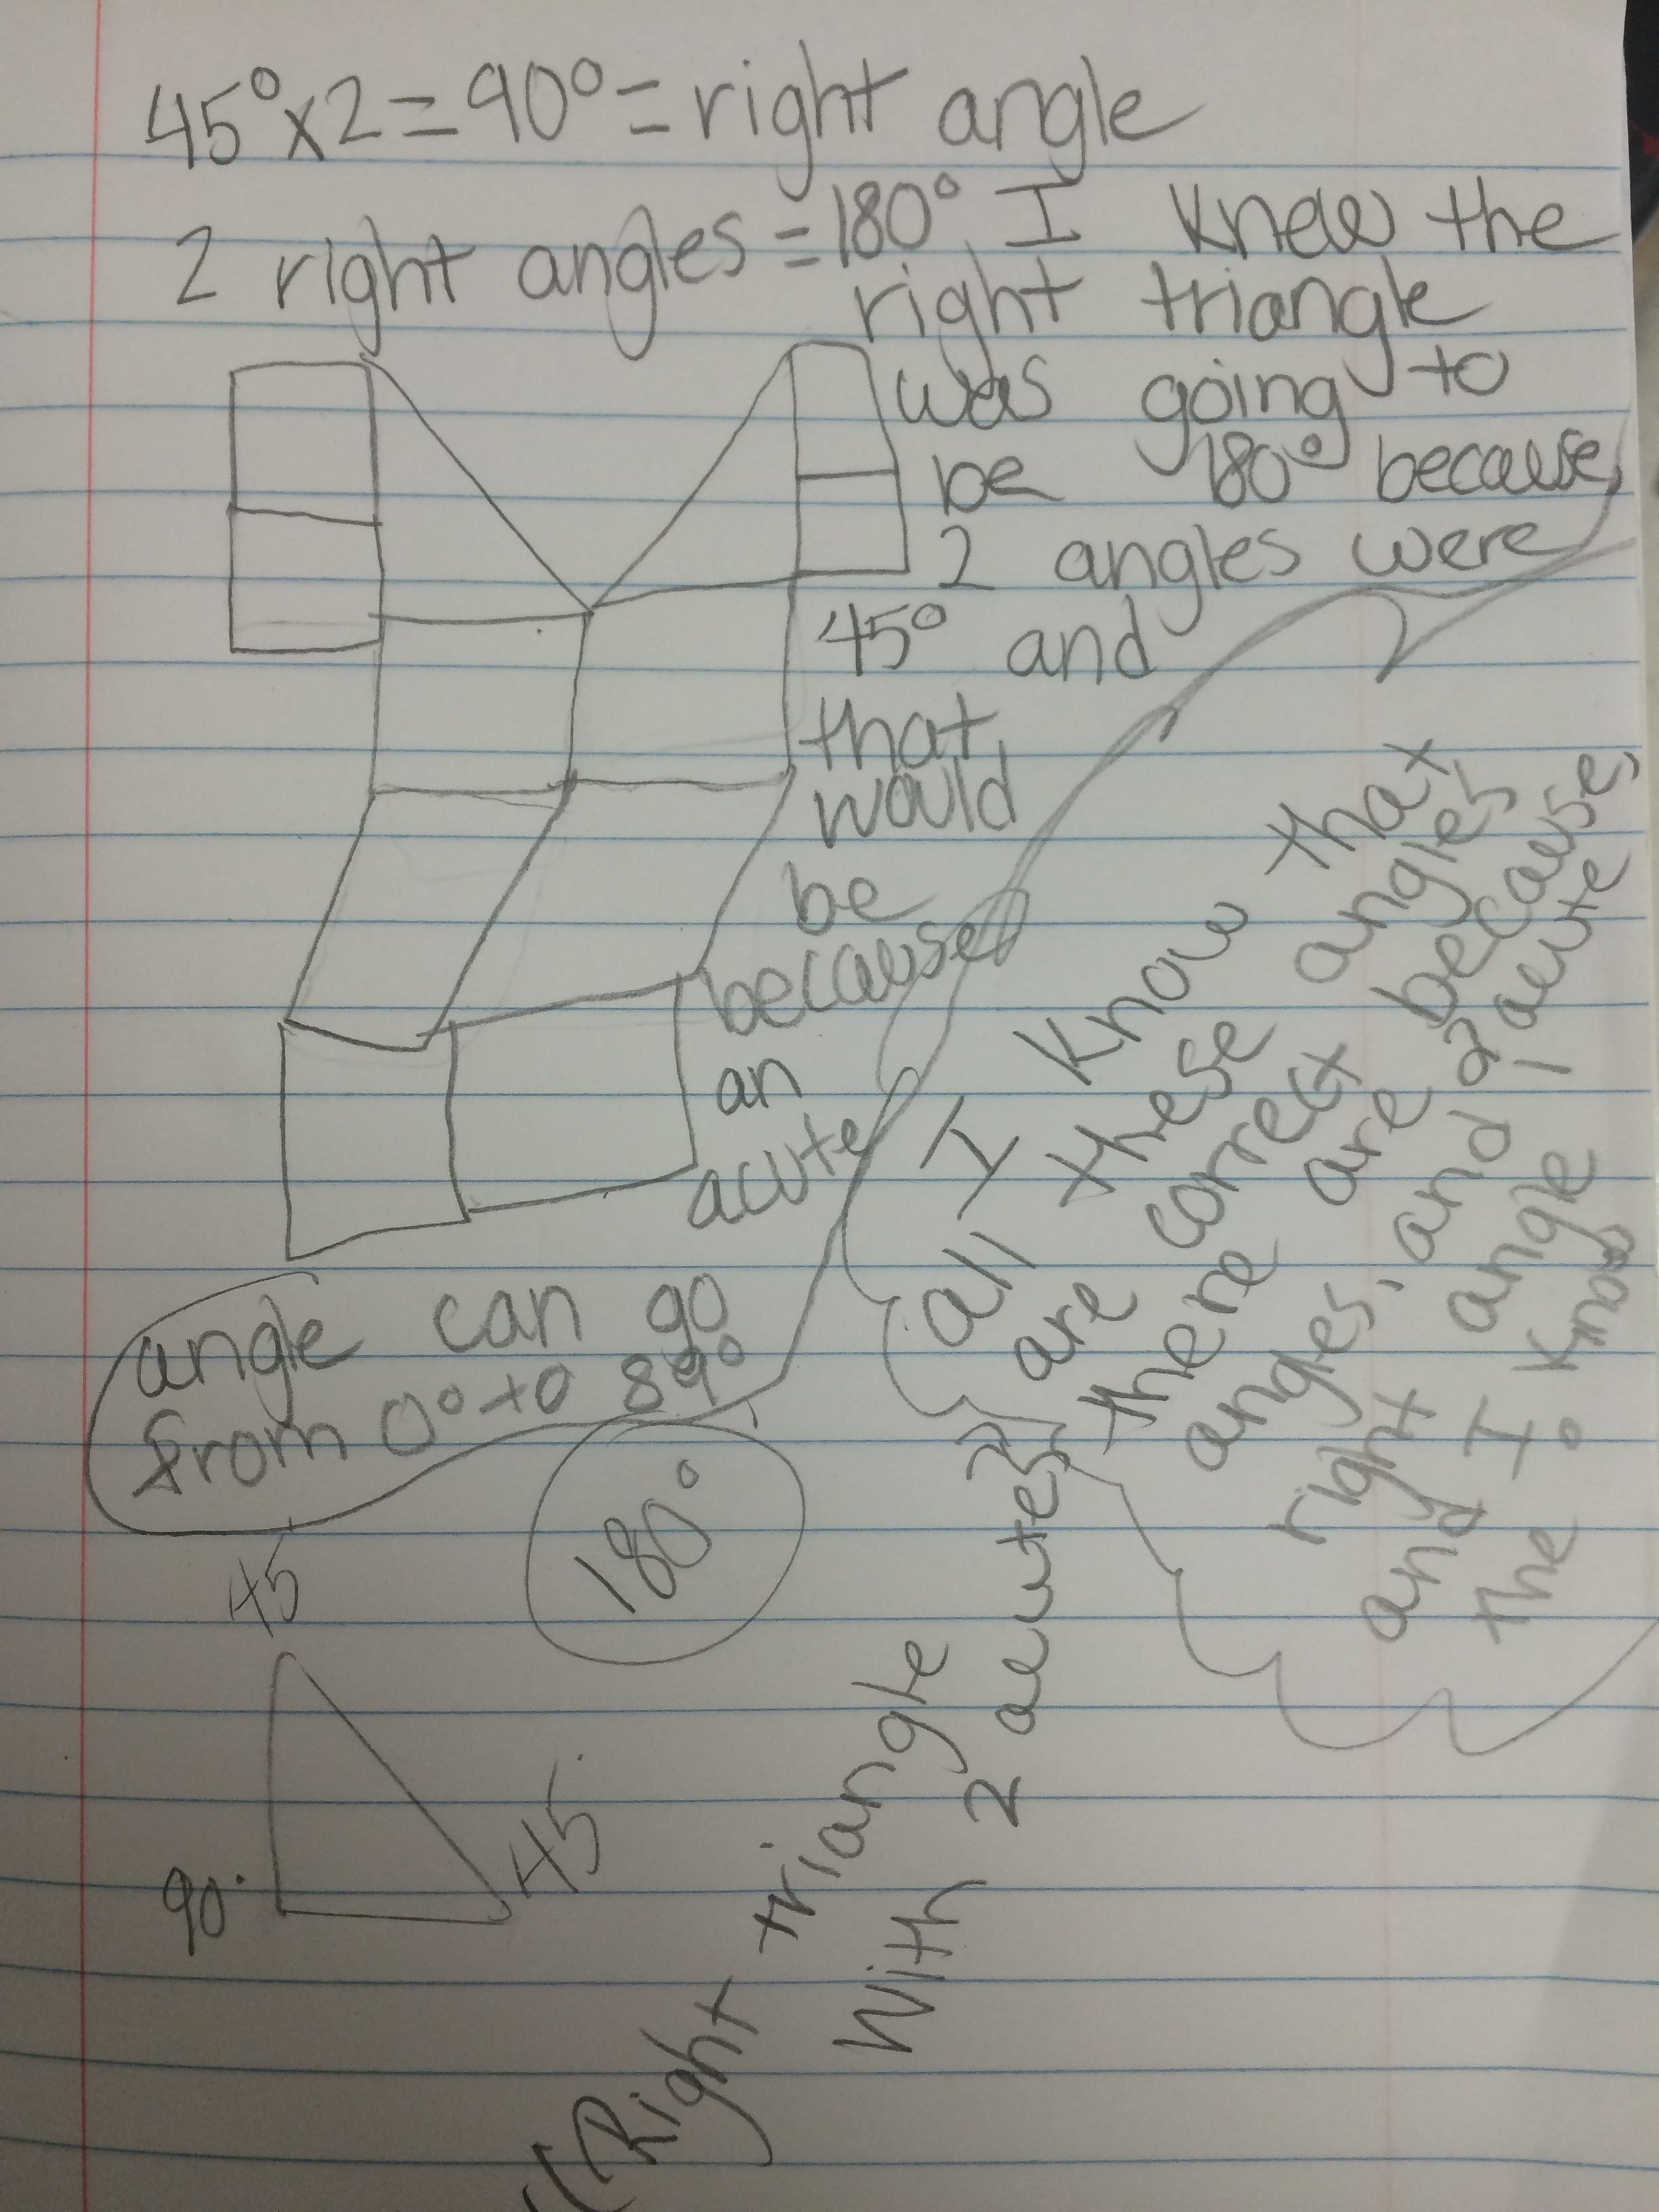
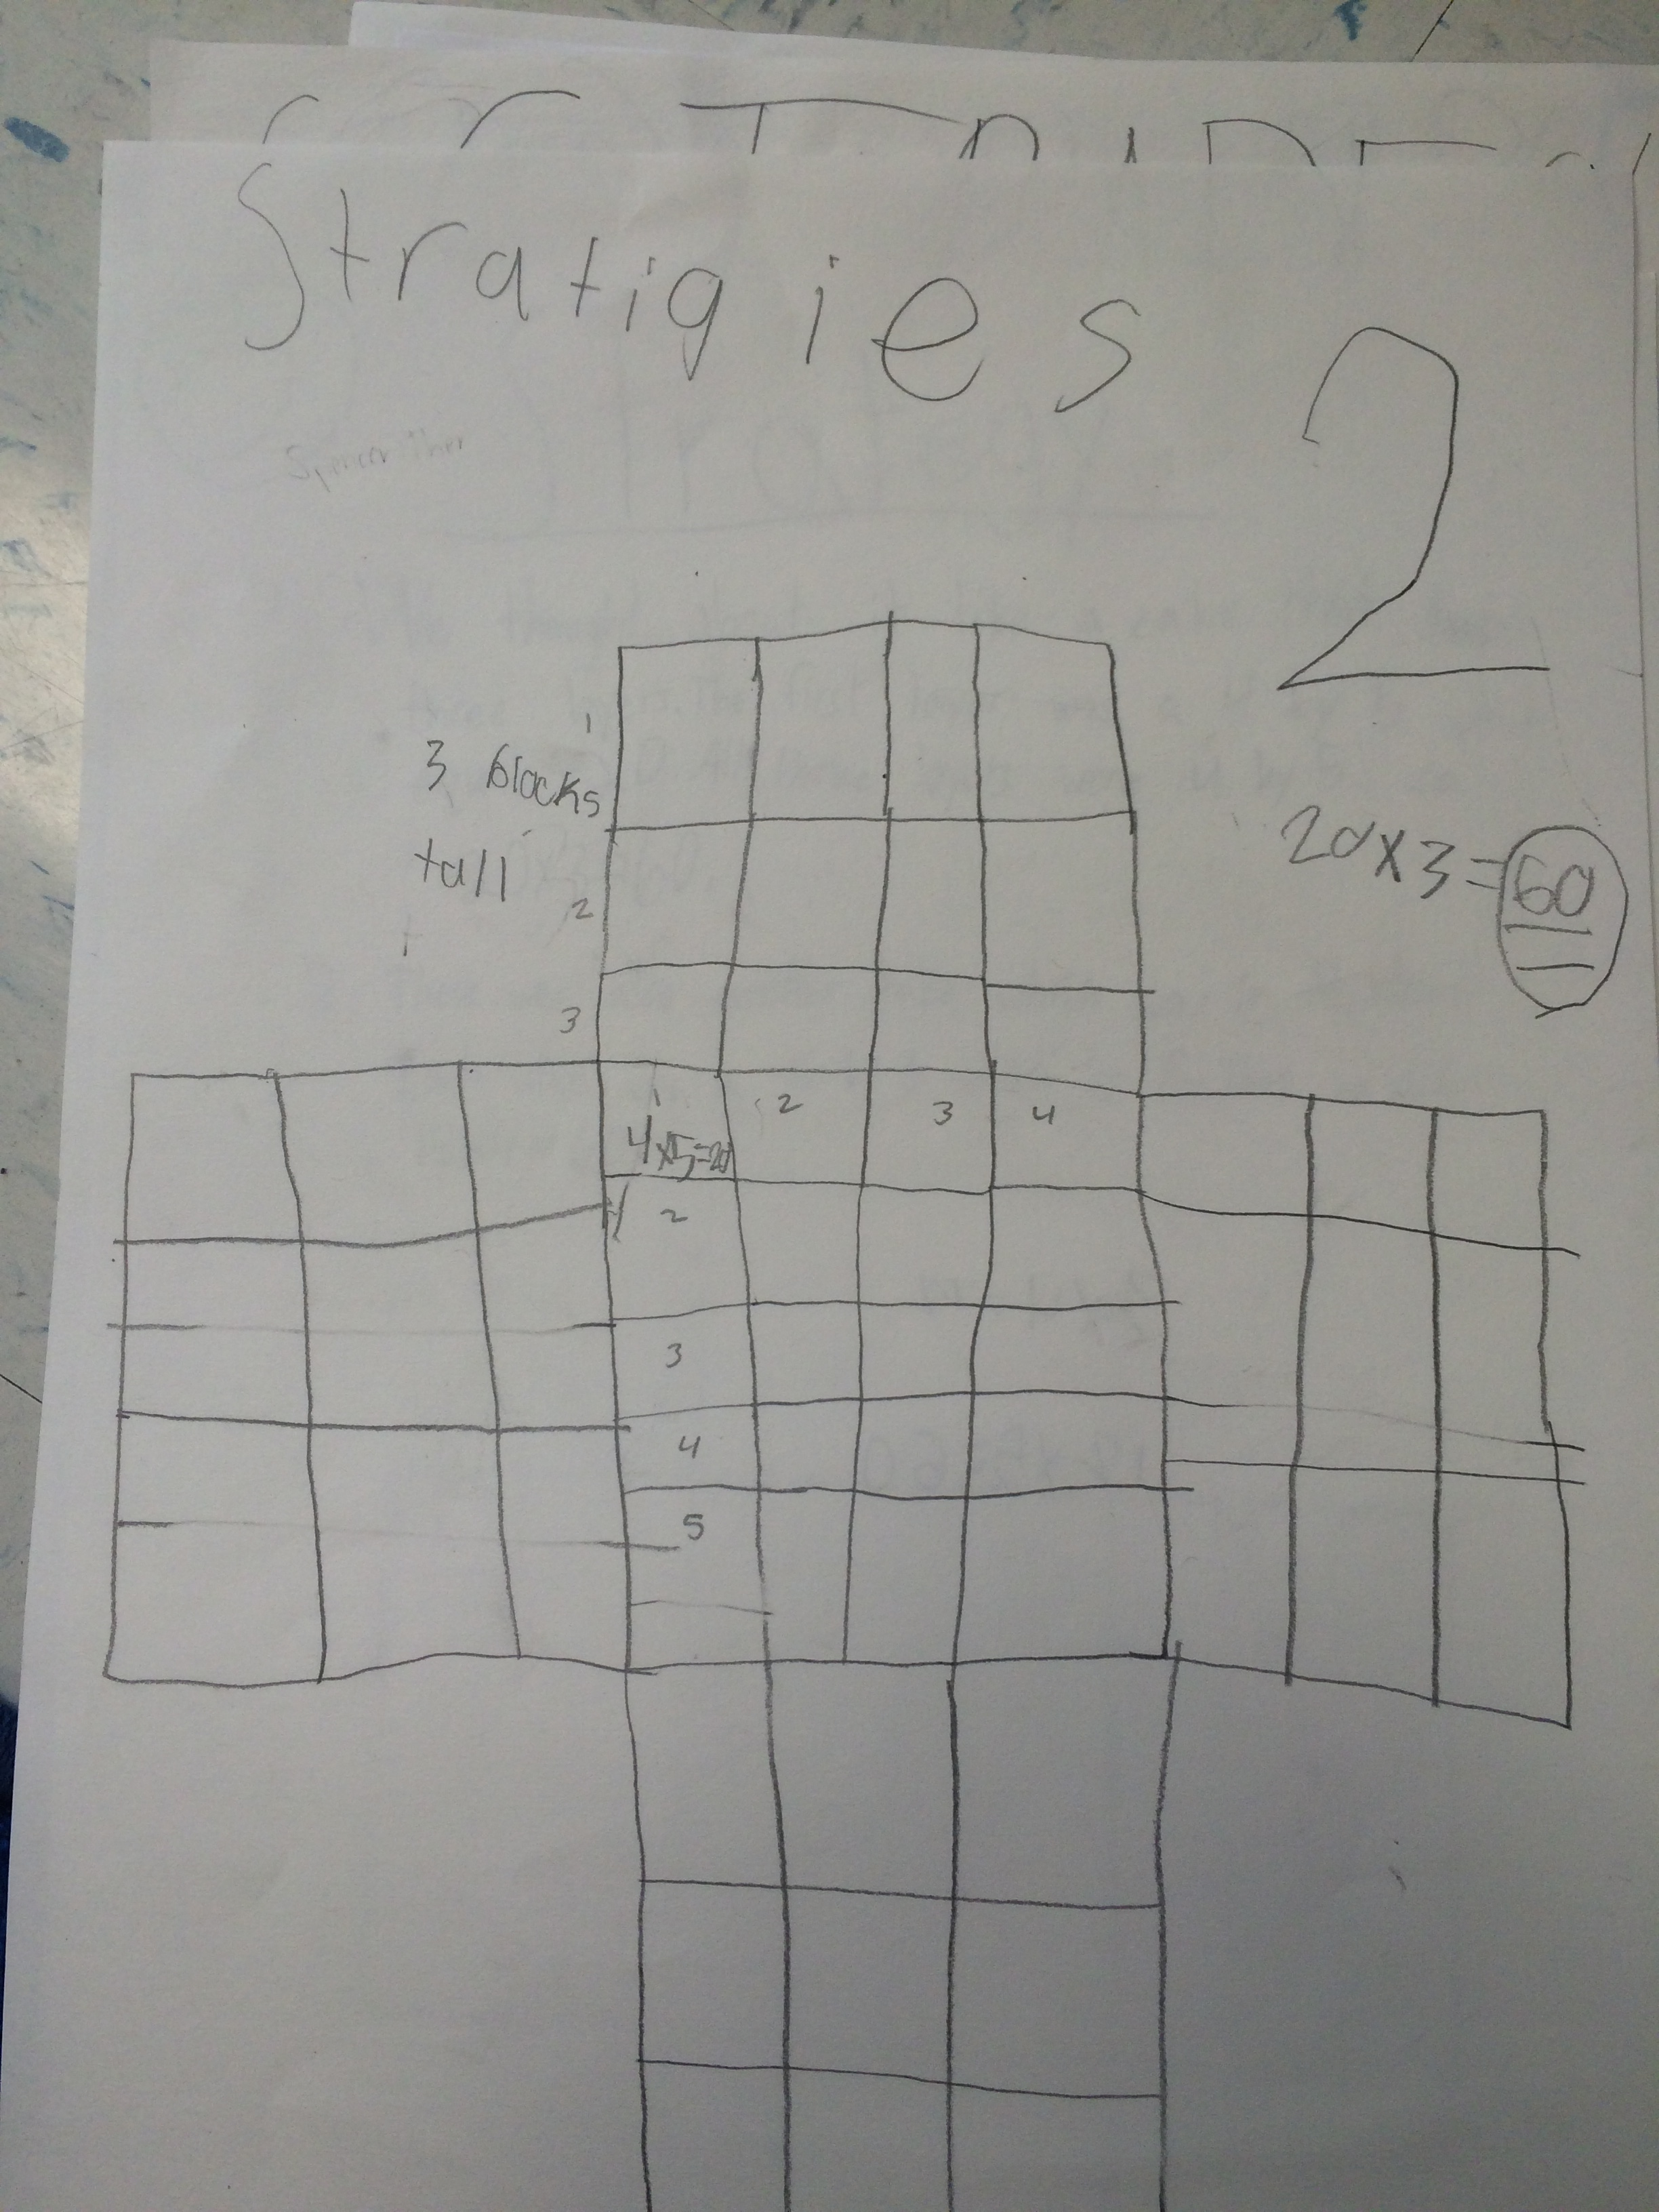
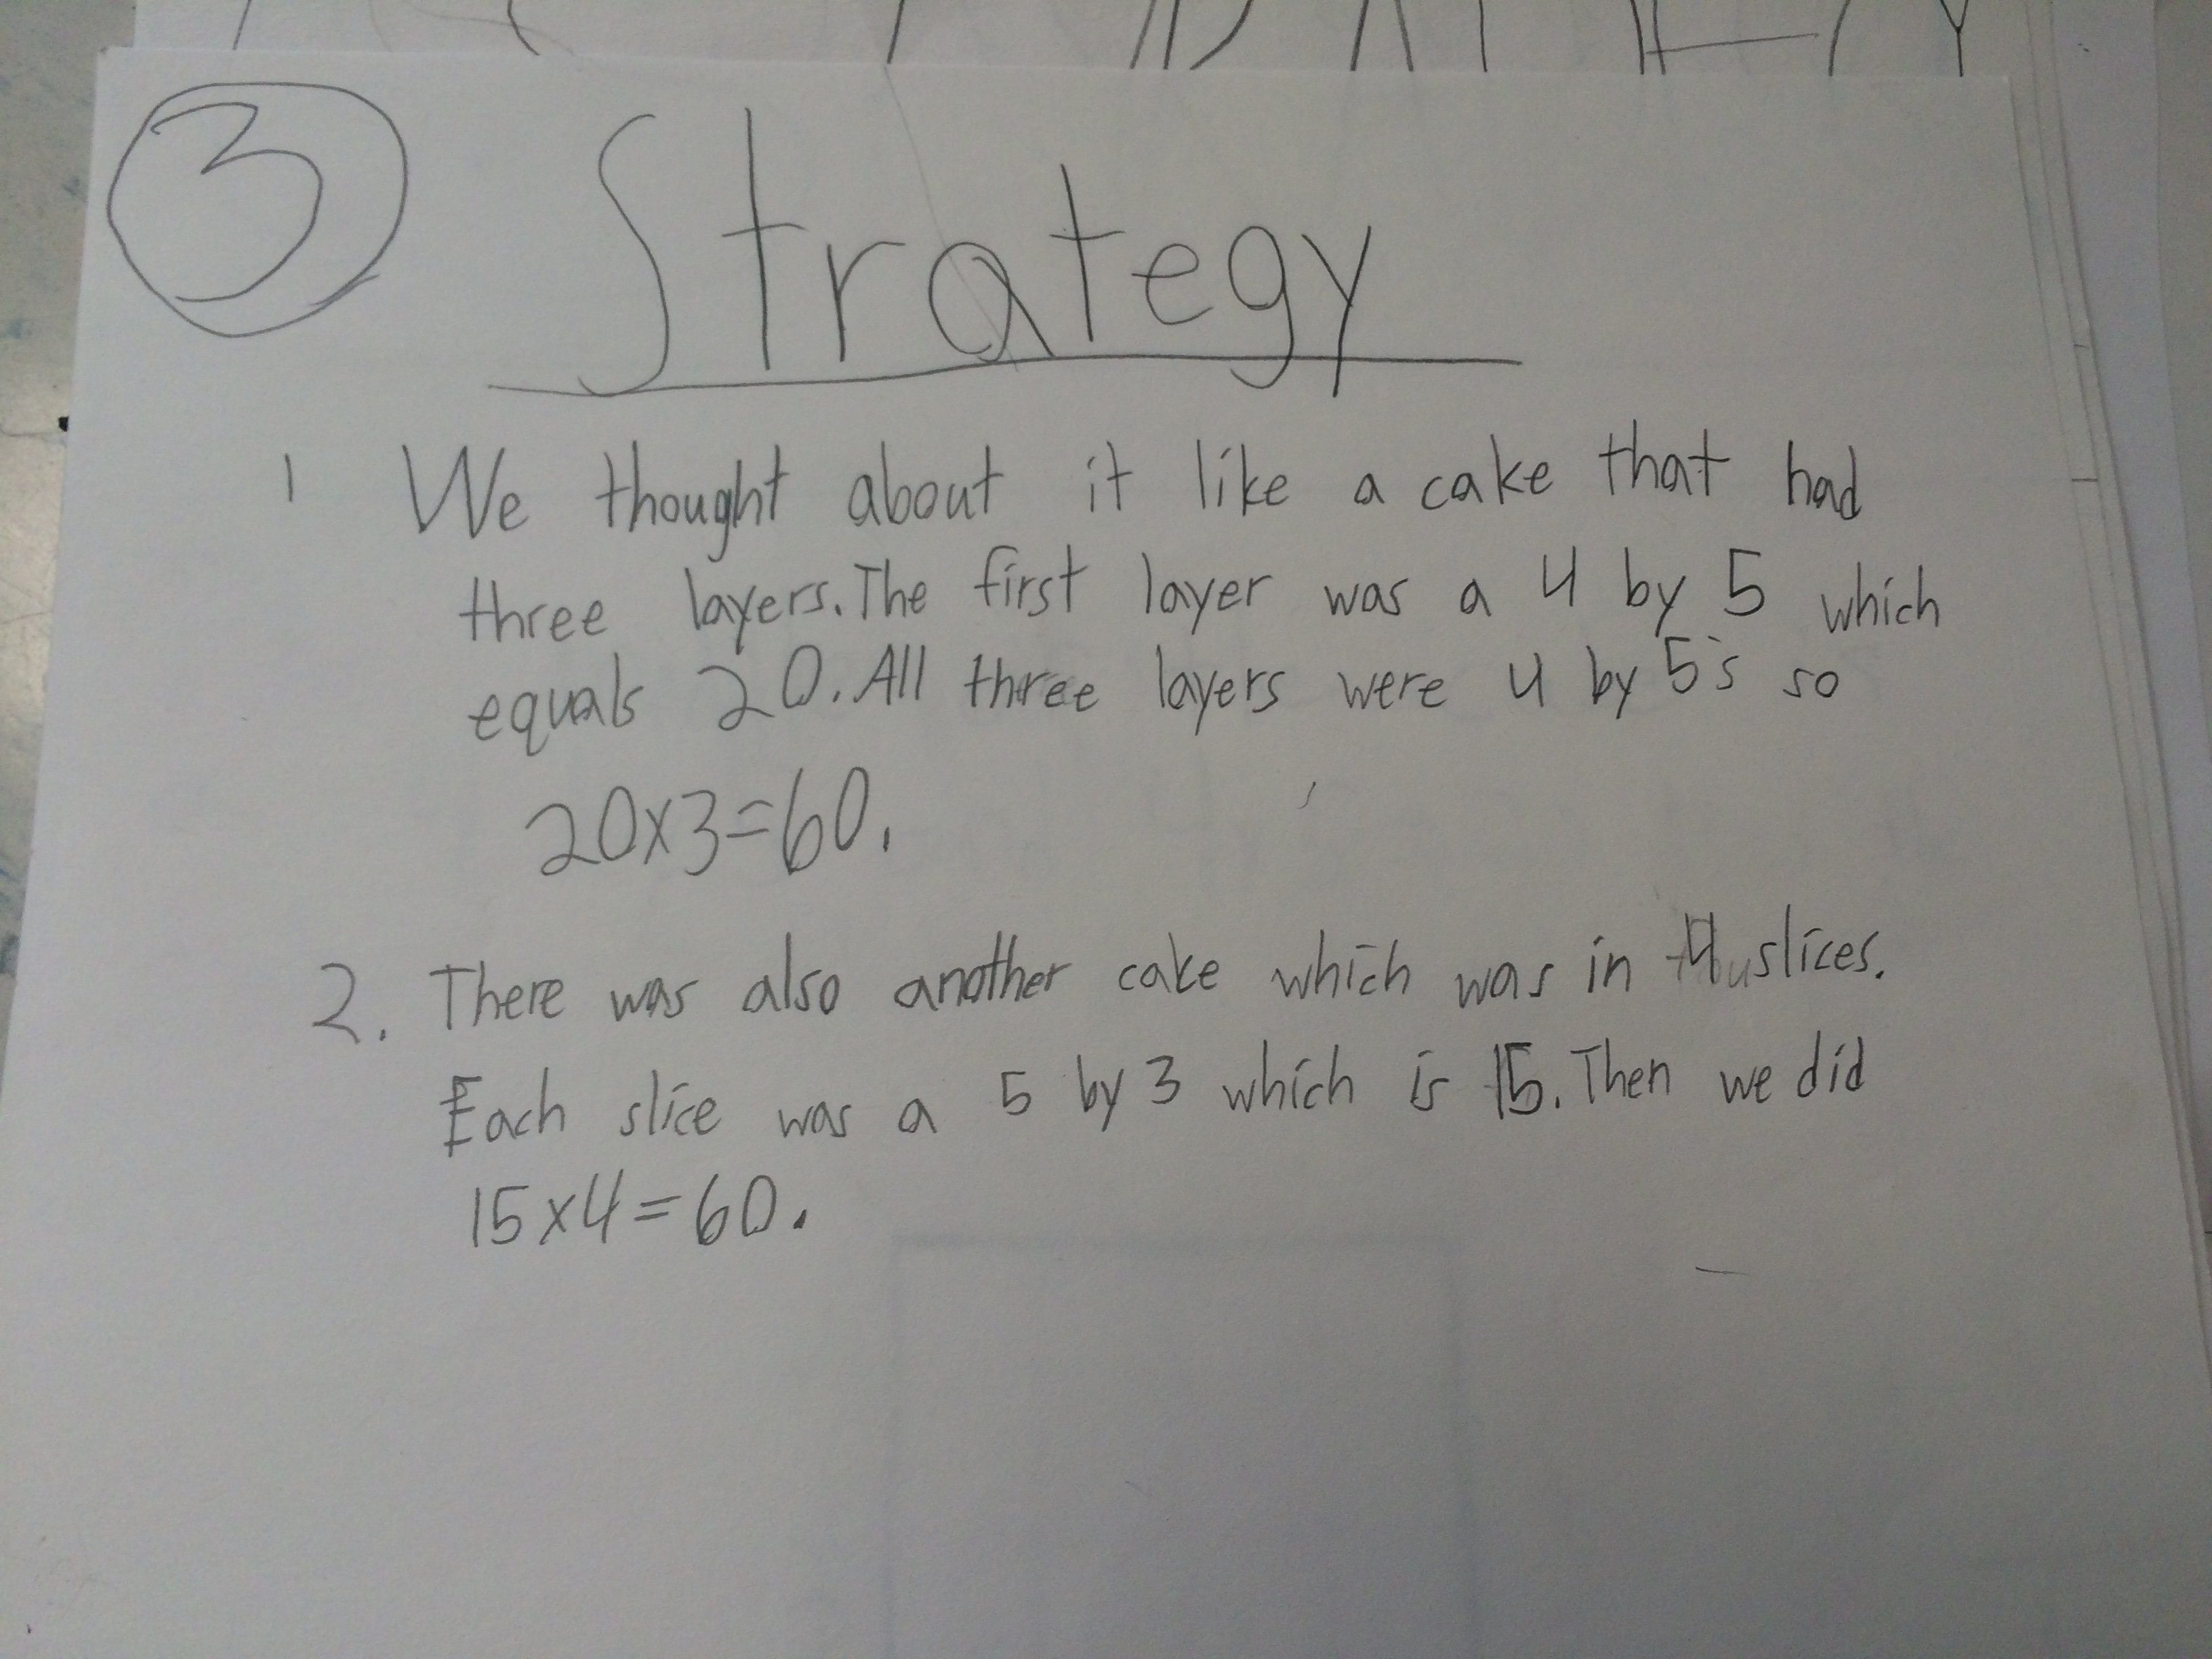
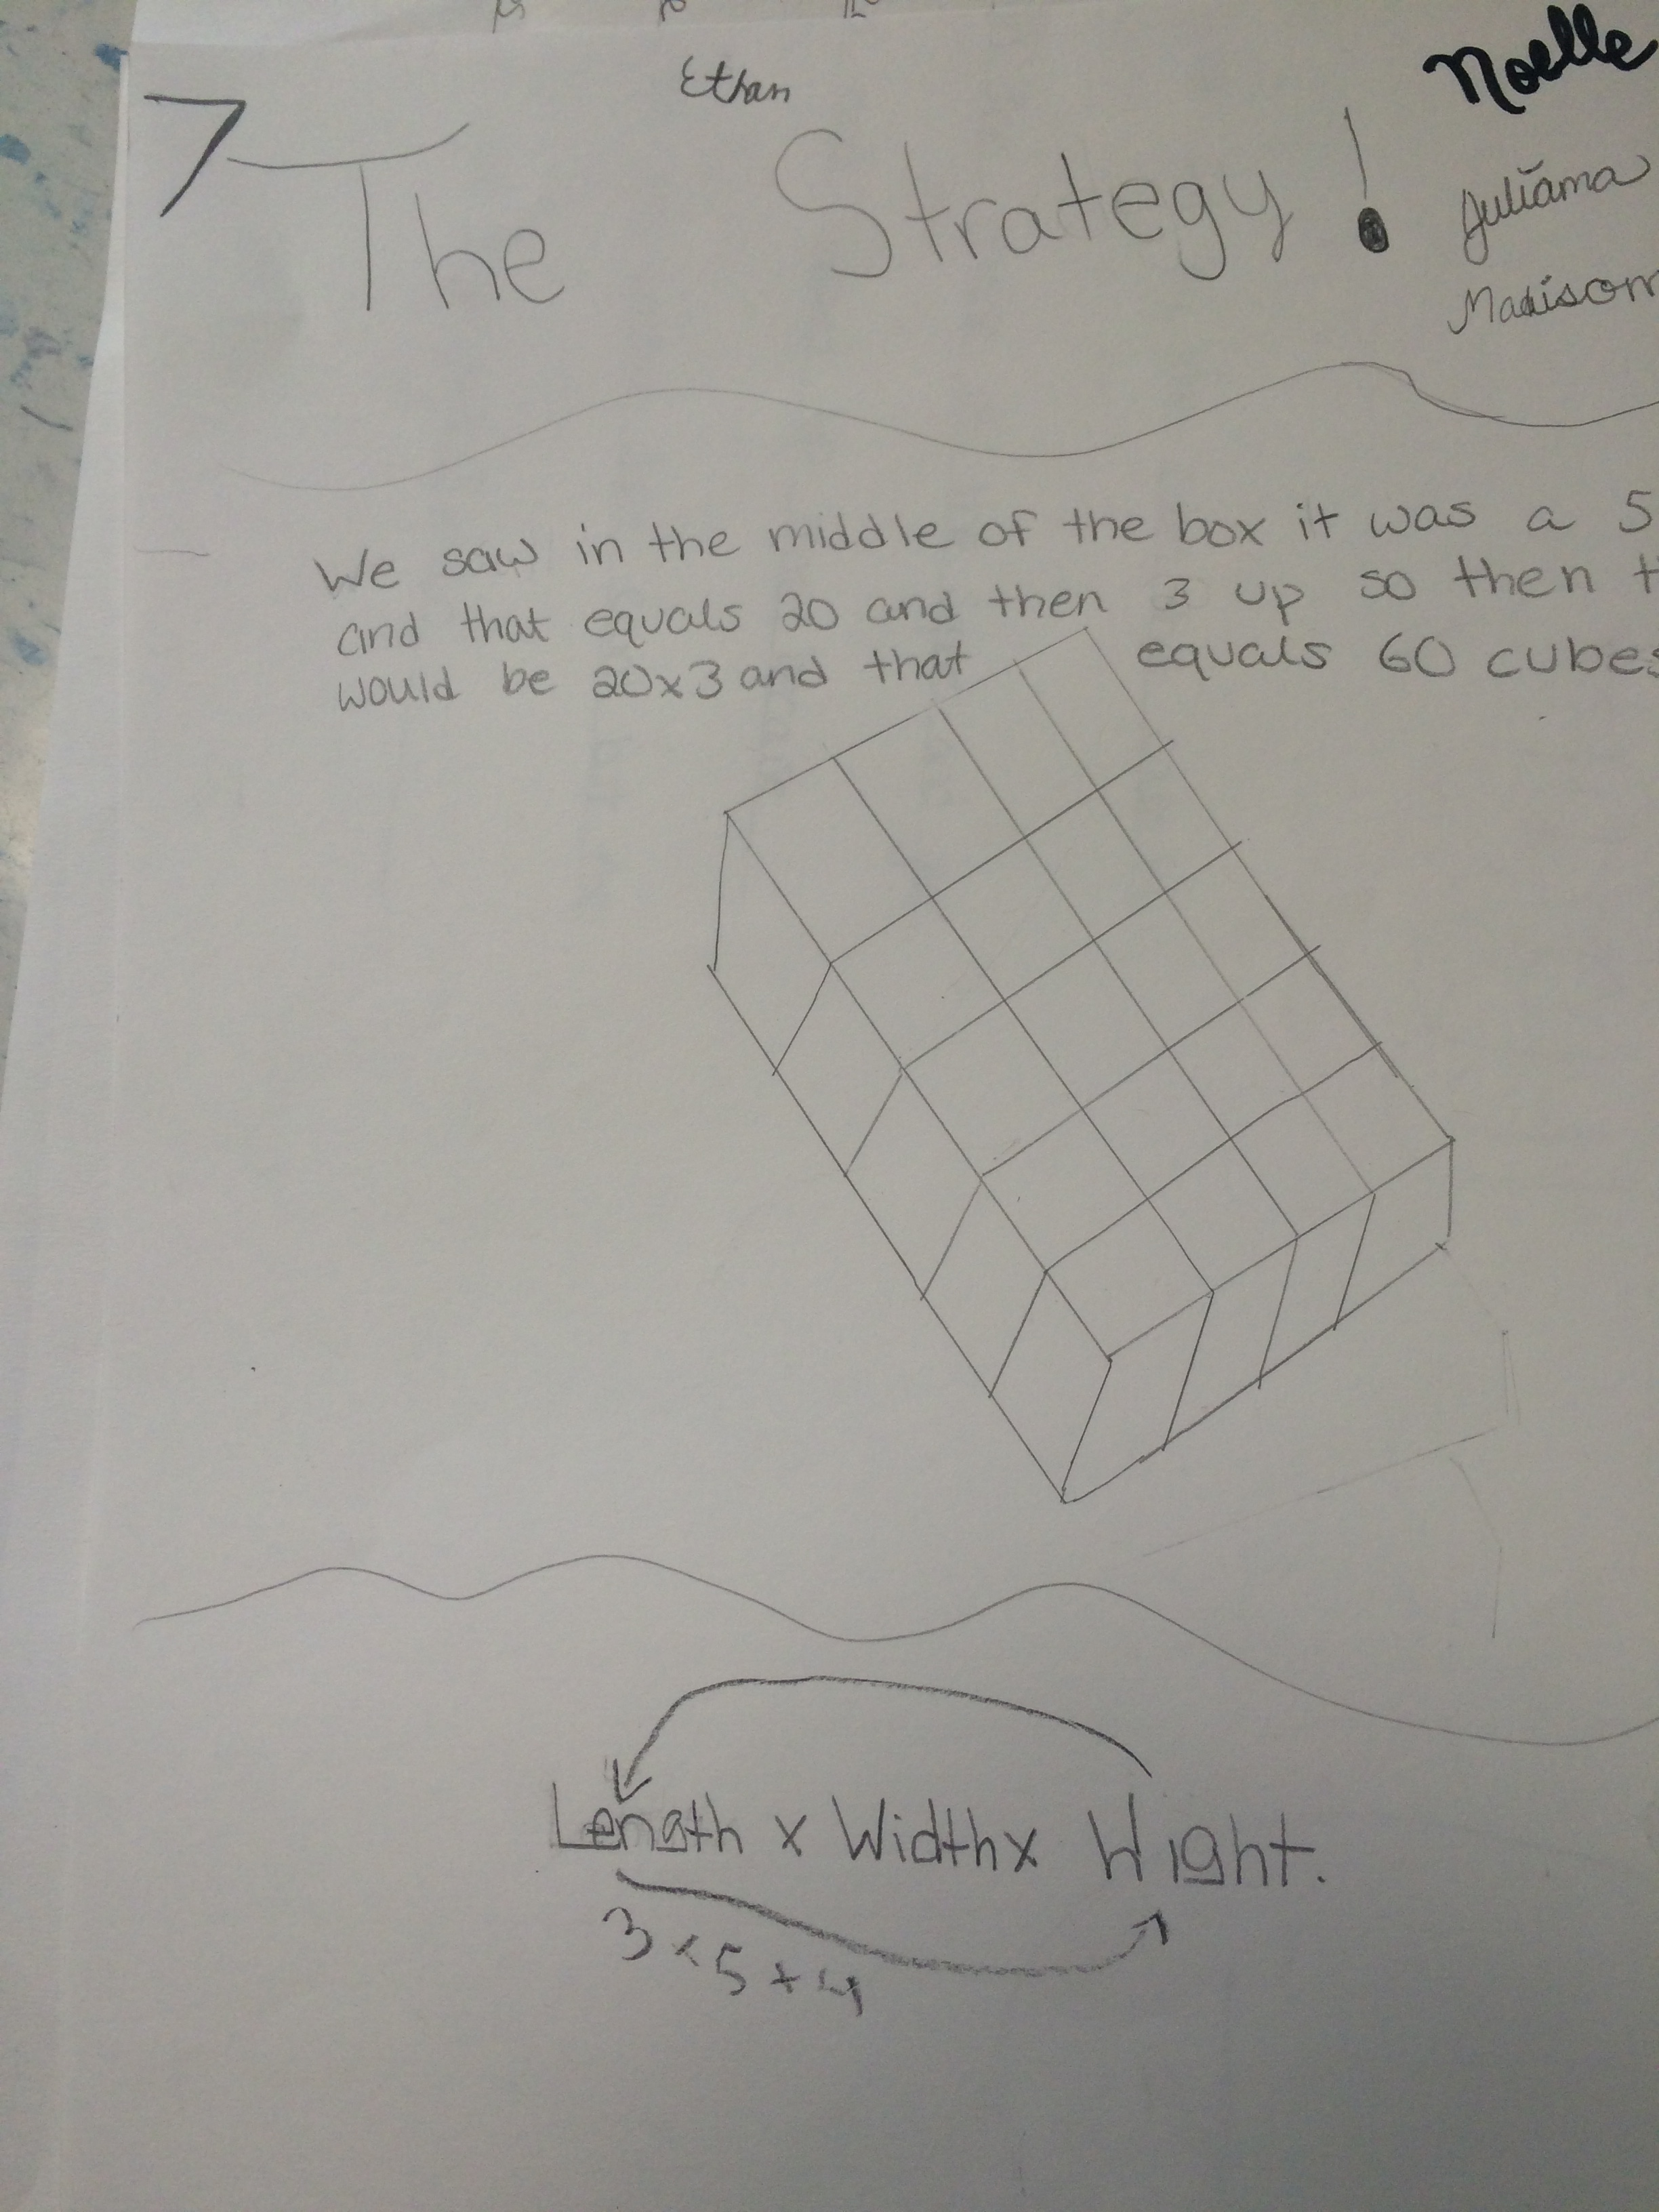
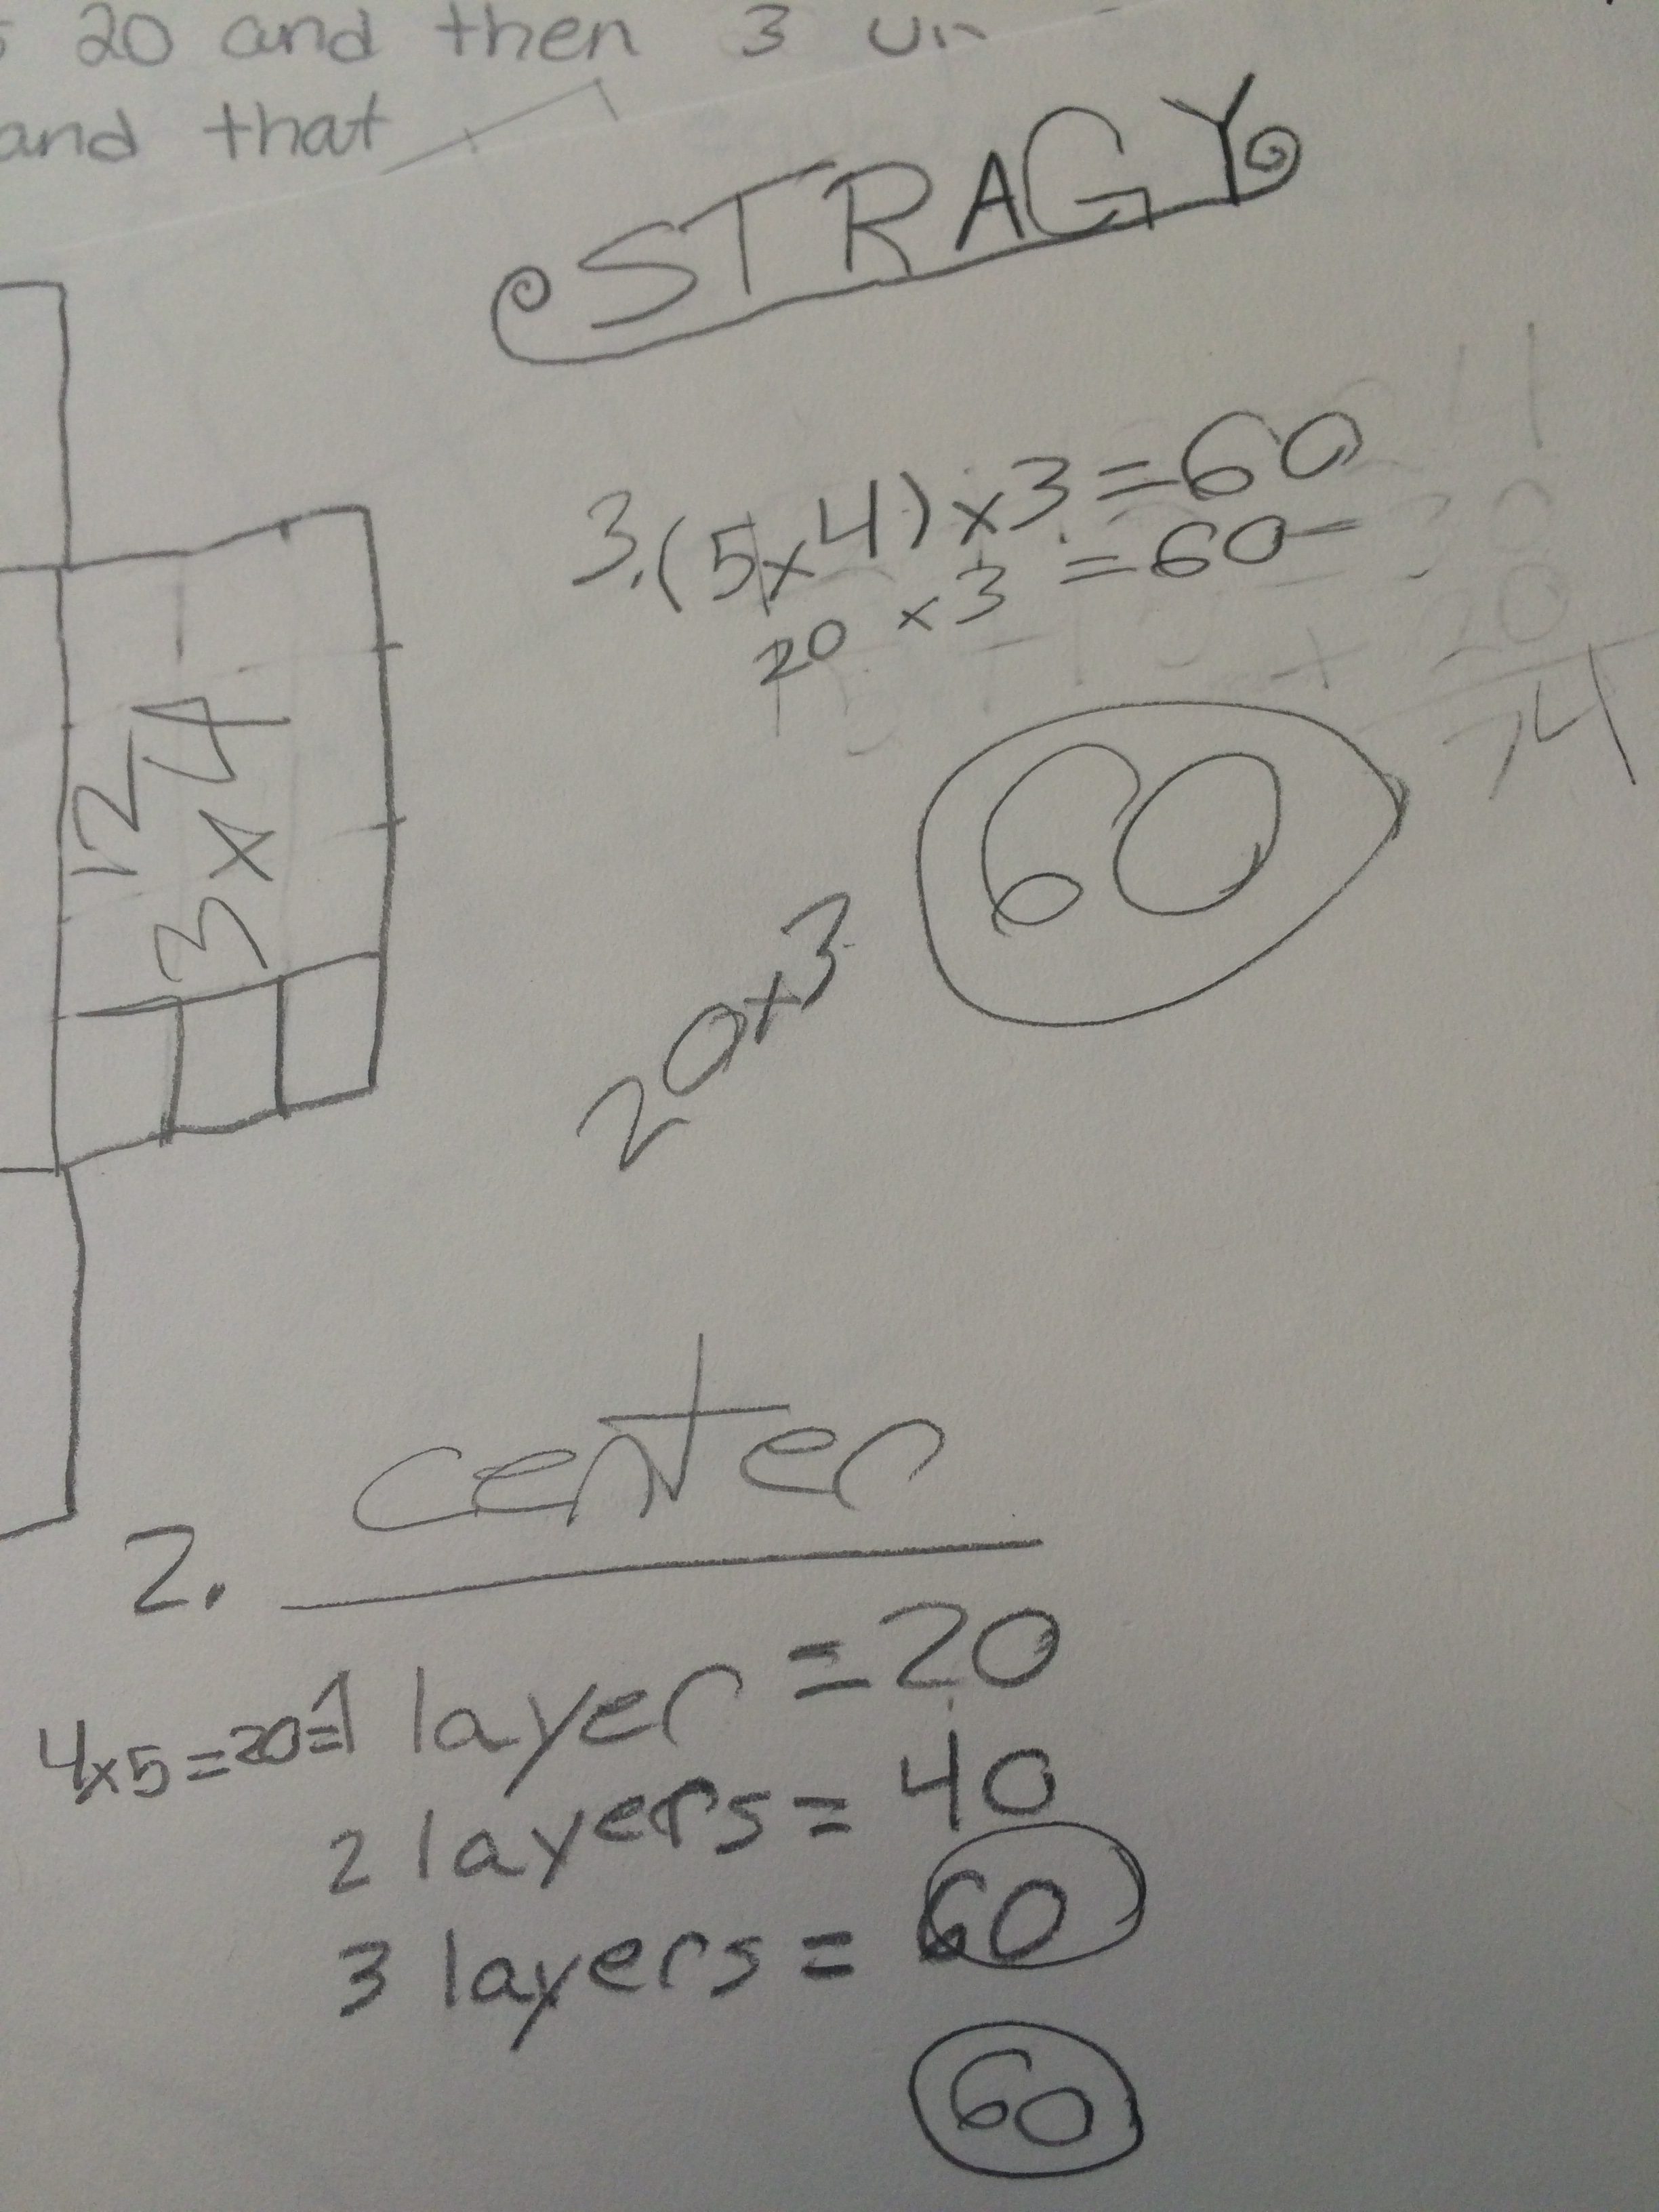
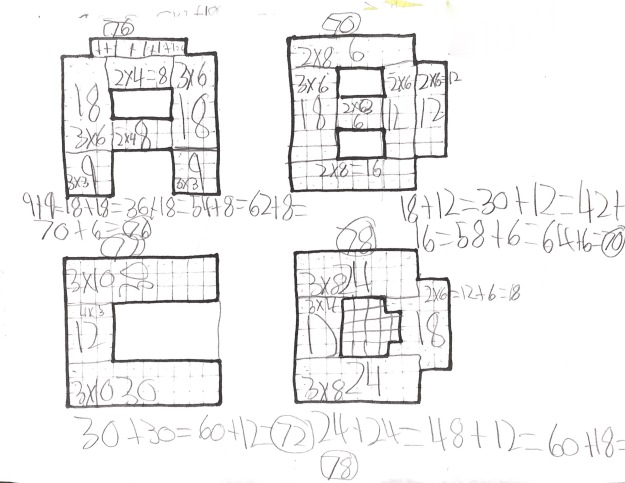
In looking at the work, I saw them as a bit of a progression of thinking. I put them in order here of how I see students moving through these ideas about area.

As I expected, some counted each row and added them. It was great they know area is additive, but I would love to ask this student if there is a way they could have used multiplication to  make it a bit easier.

Scannable Document 17 on Feb 6, 2017, 6_15_11 PM (1).jpg

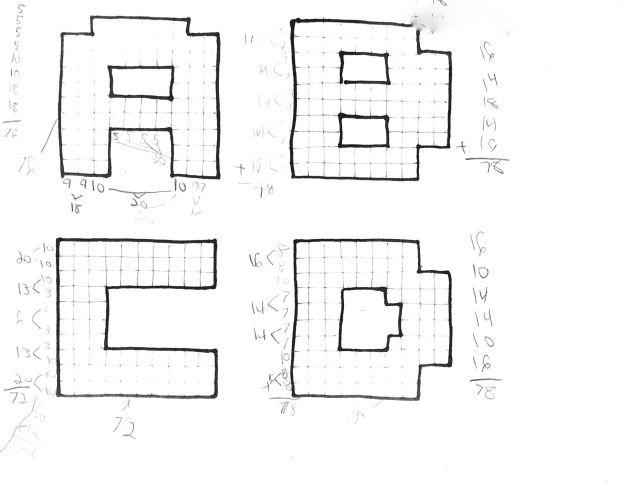
Some added in chunks, to which I would love to ask the same question. I was excited to see them cutting the shapes up into rectangles in places that made sense.

Scannable Document 8 on Feb 6, 2017, 6_15_11 PM.jpg
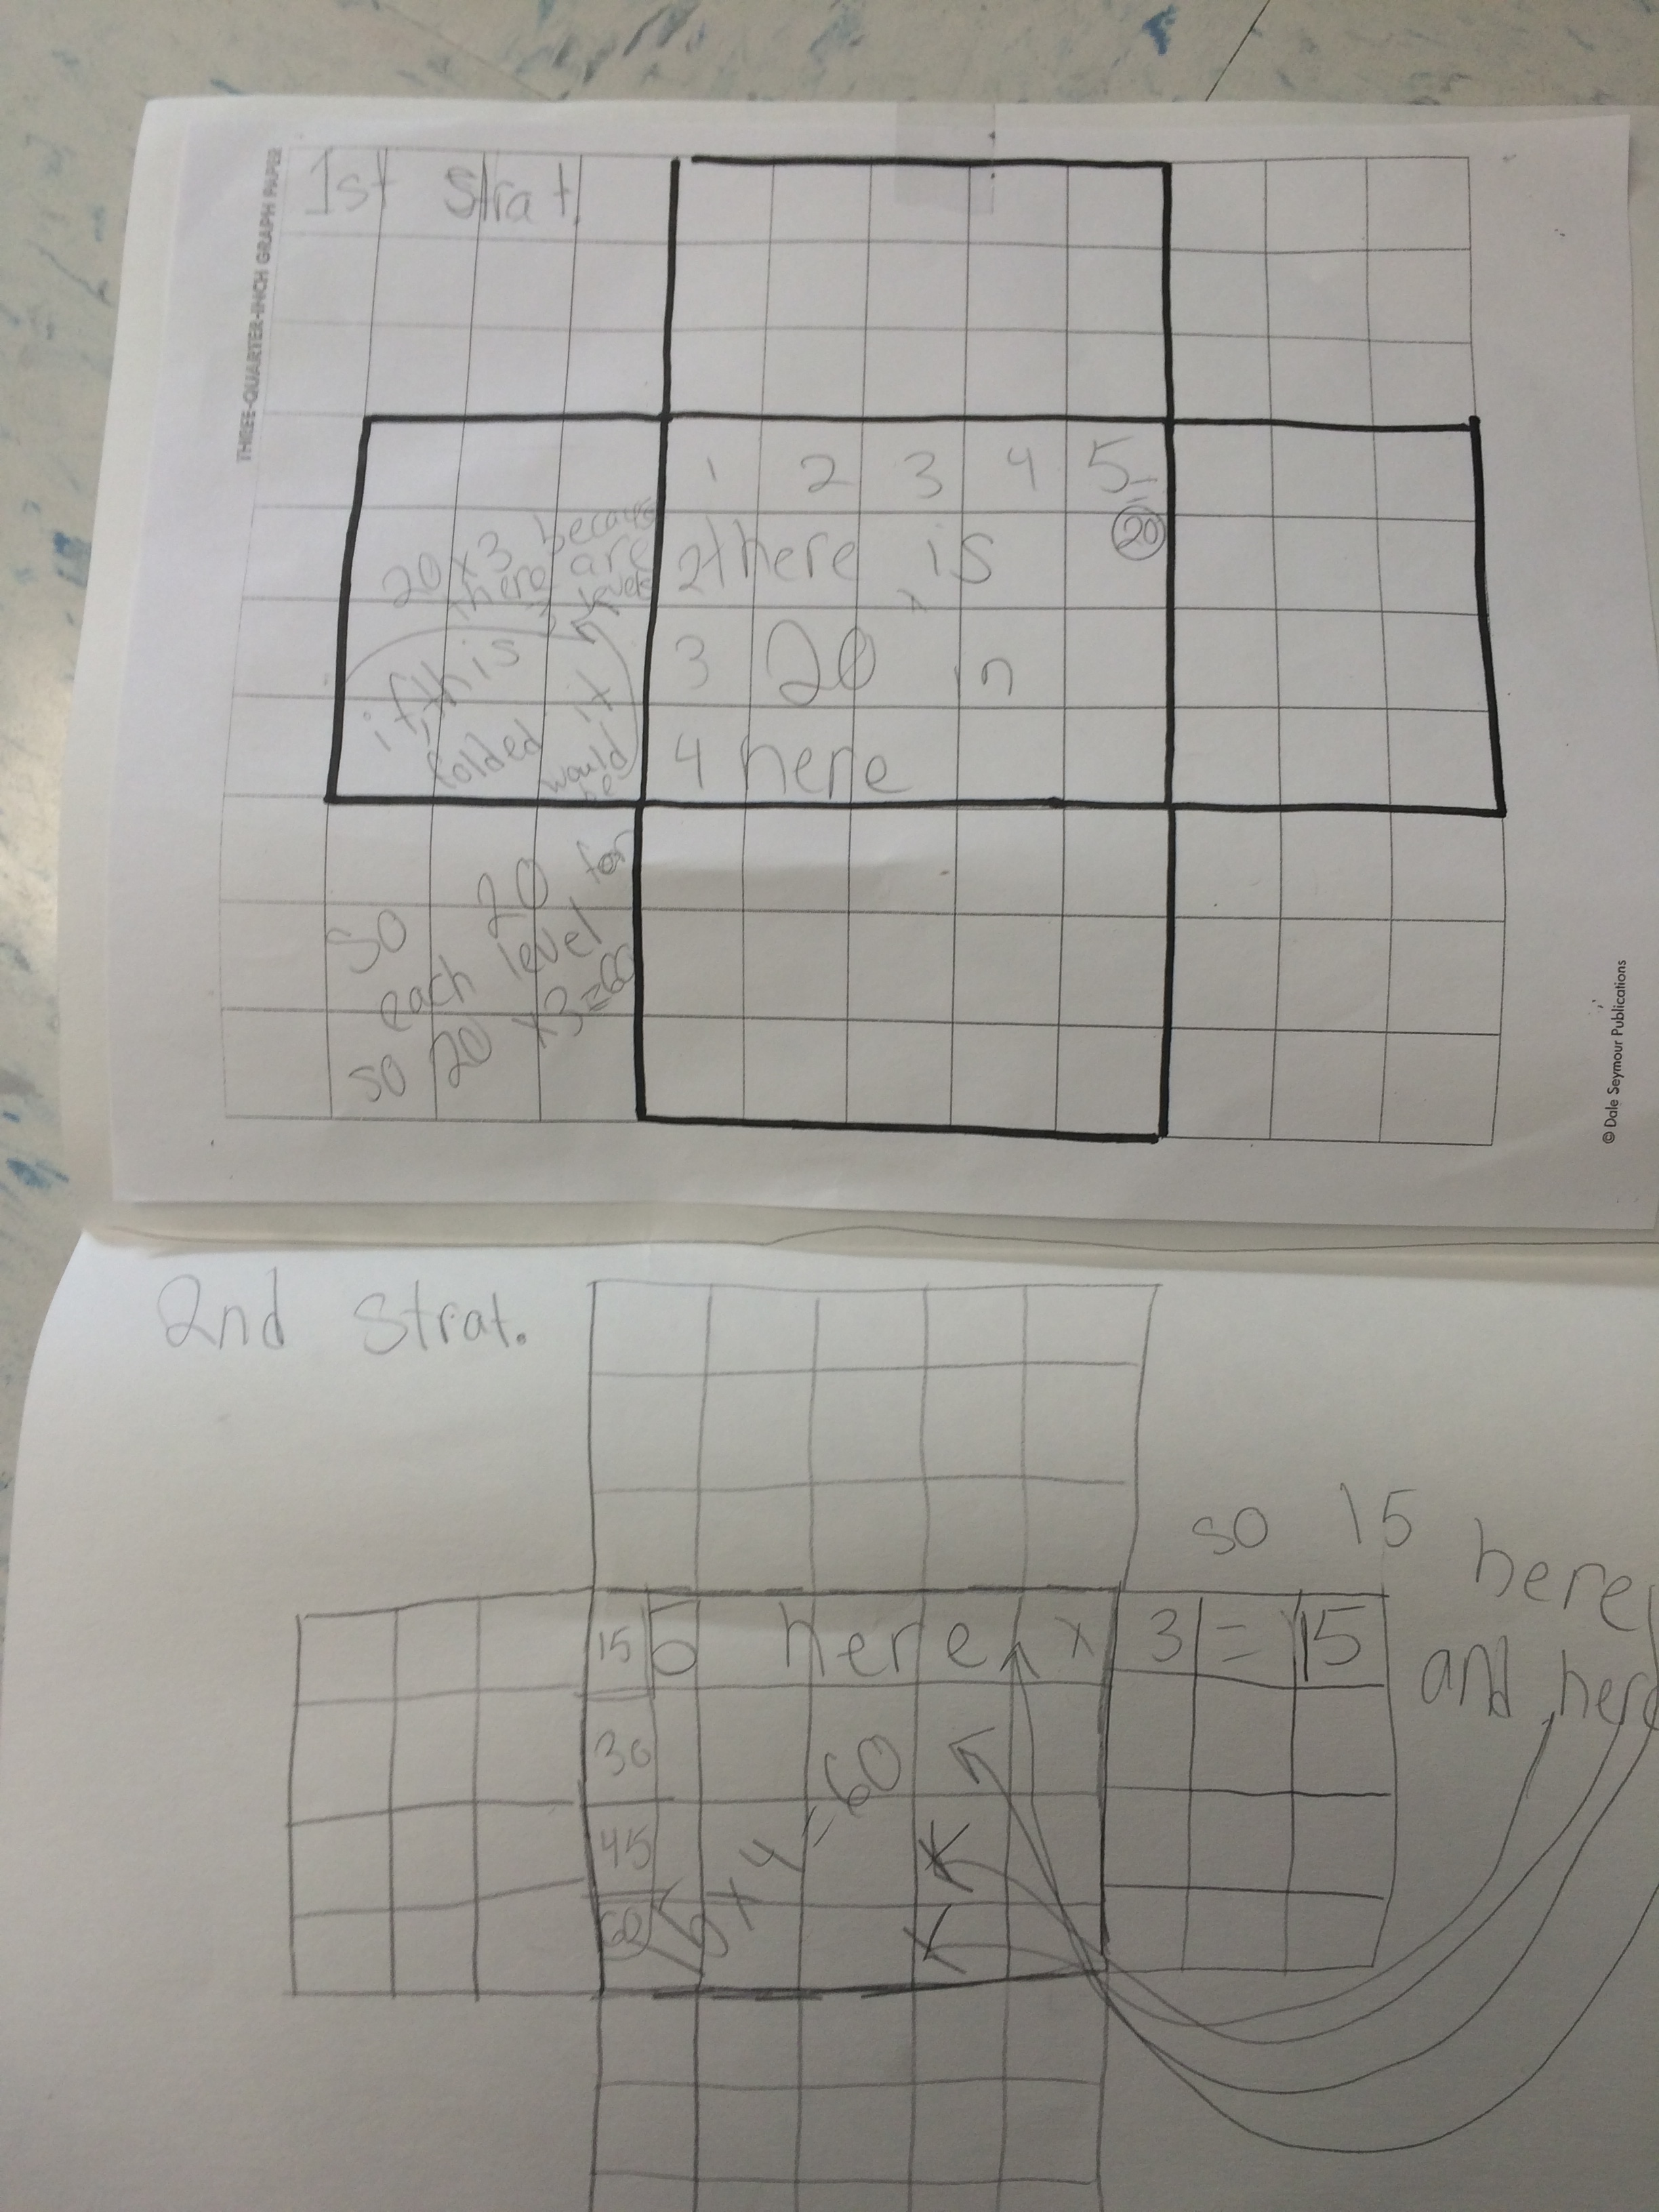
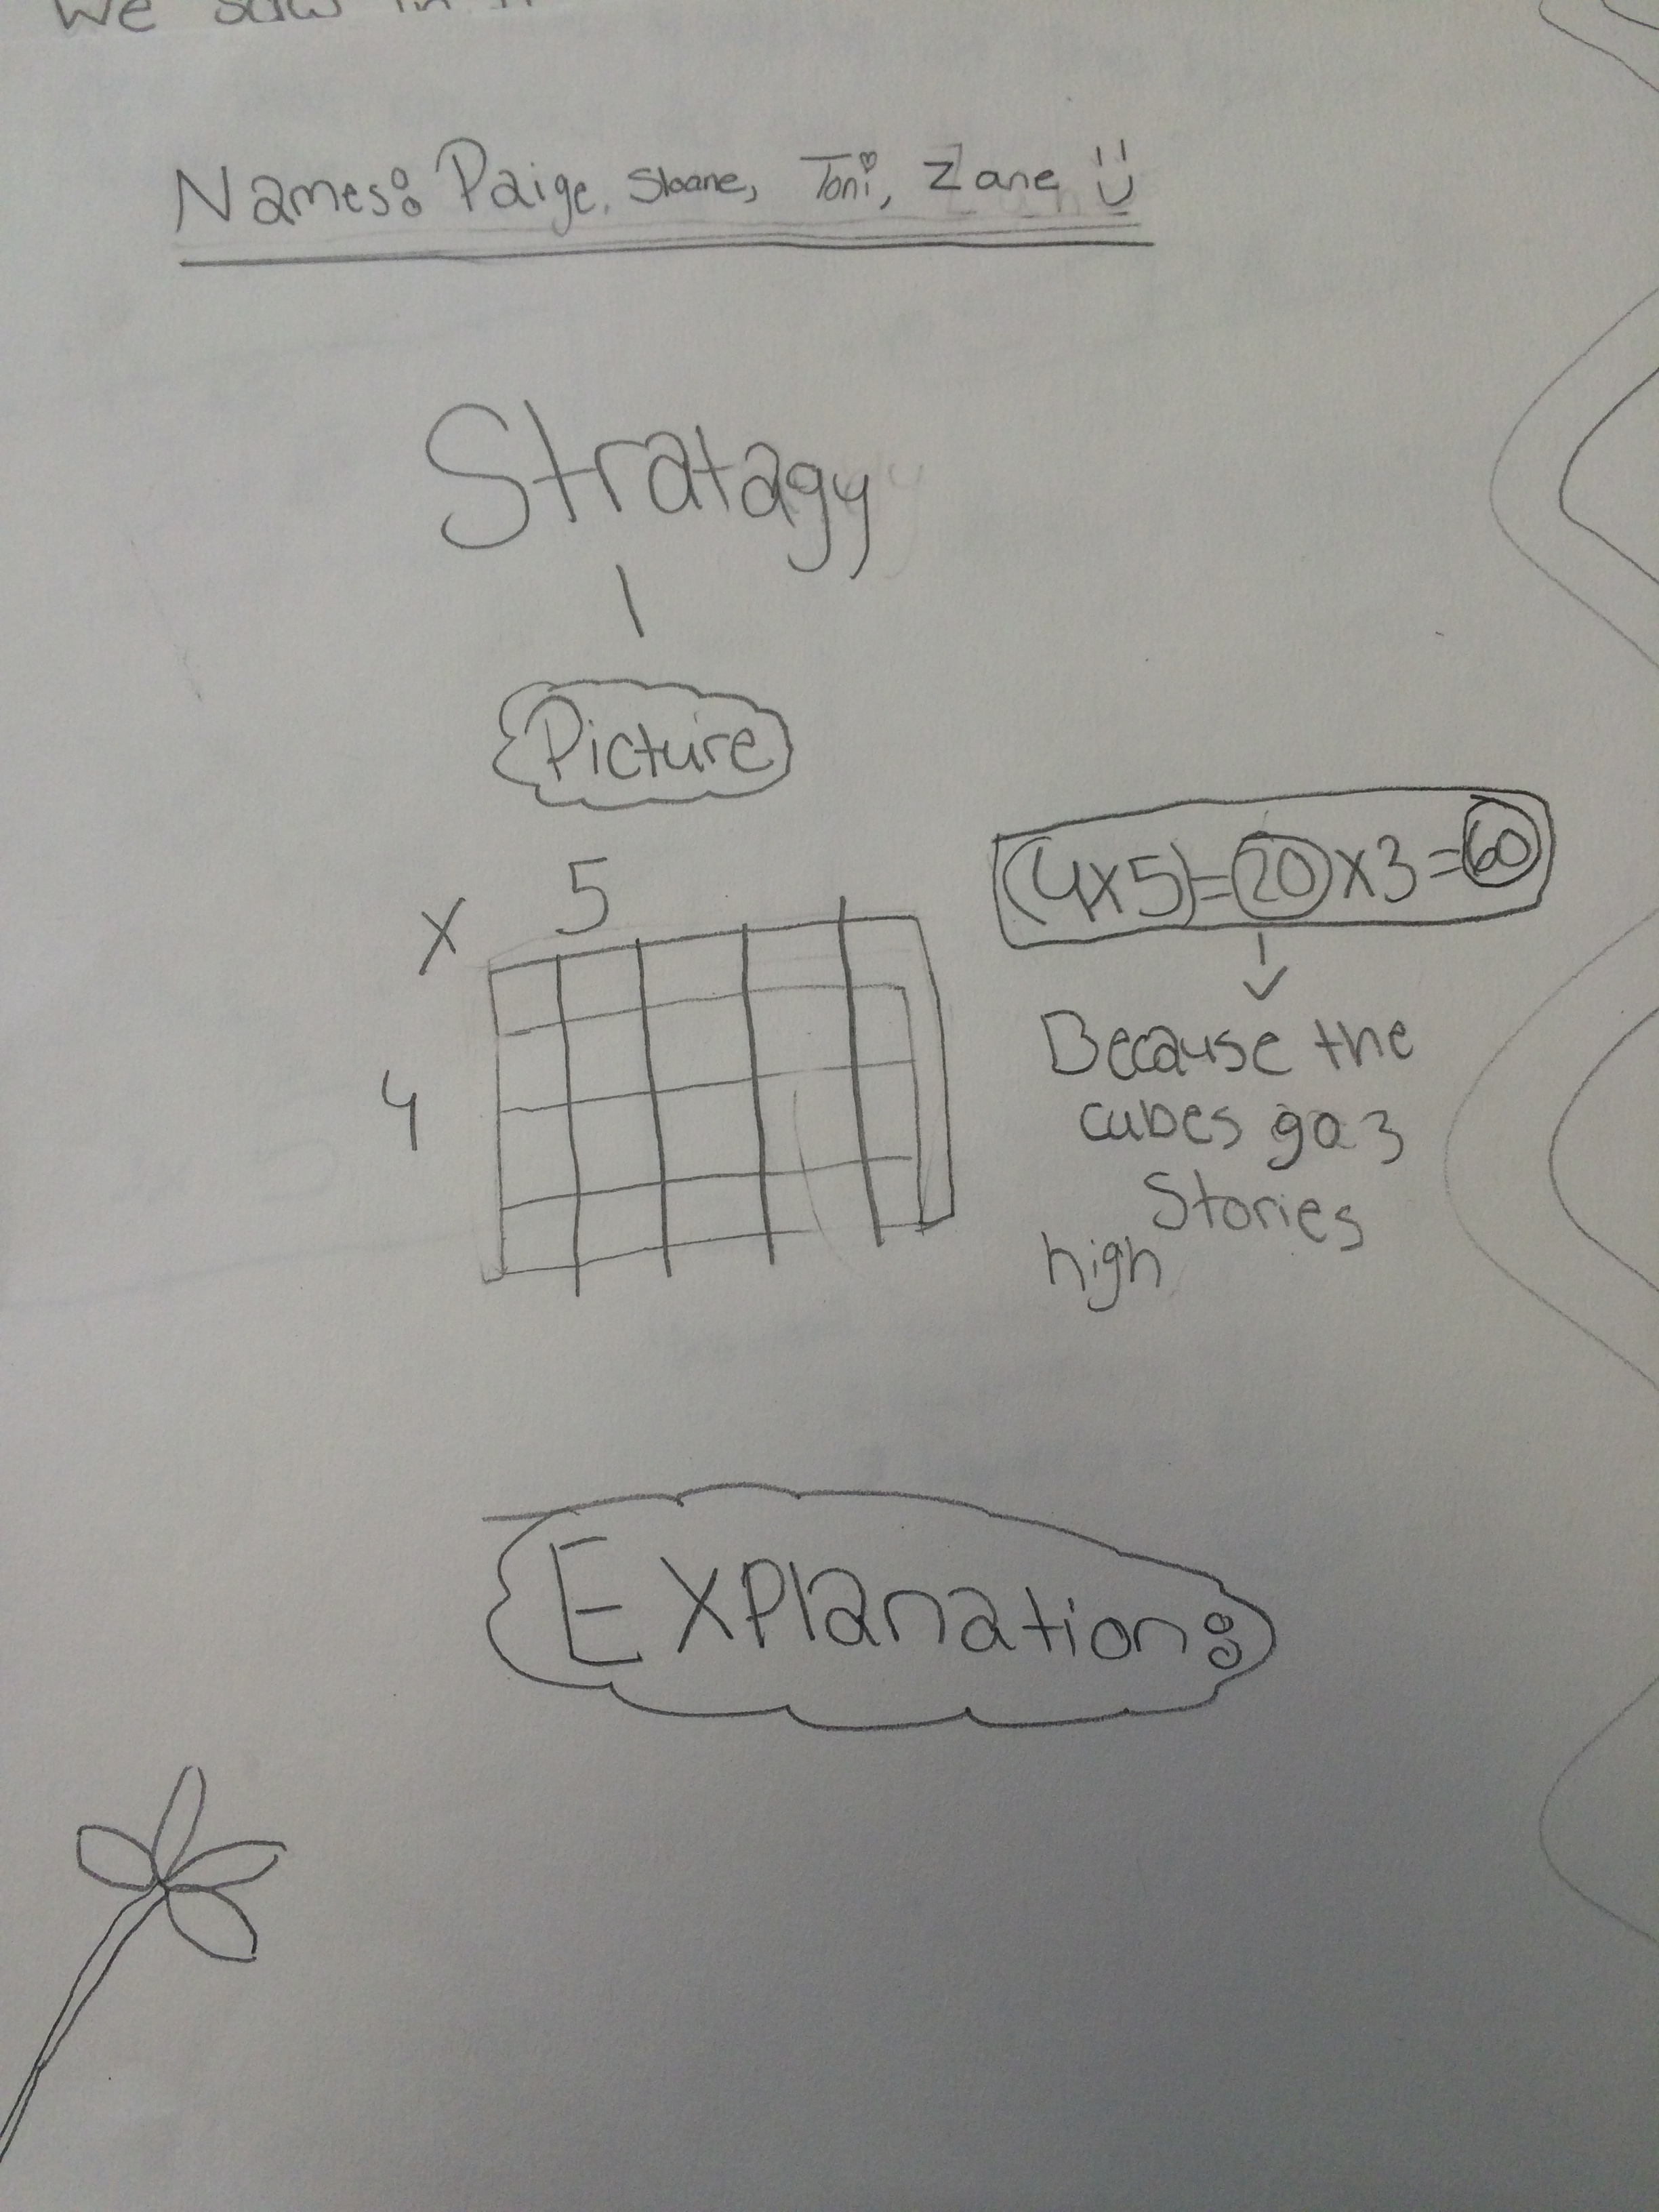
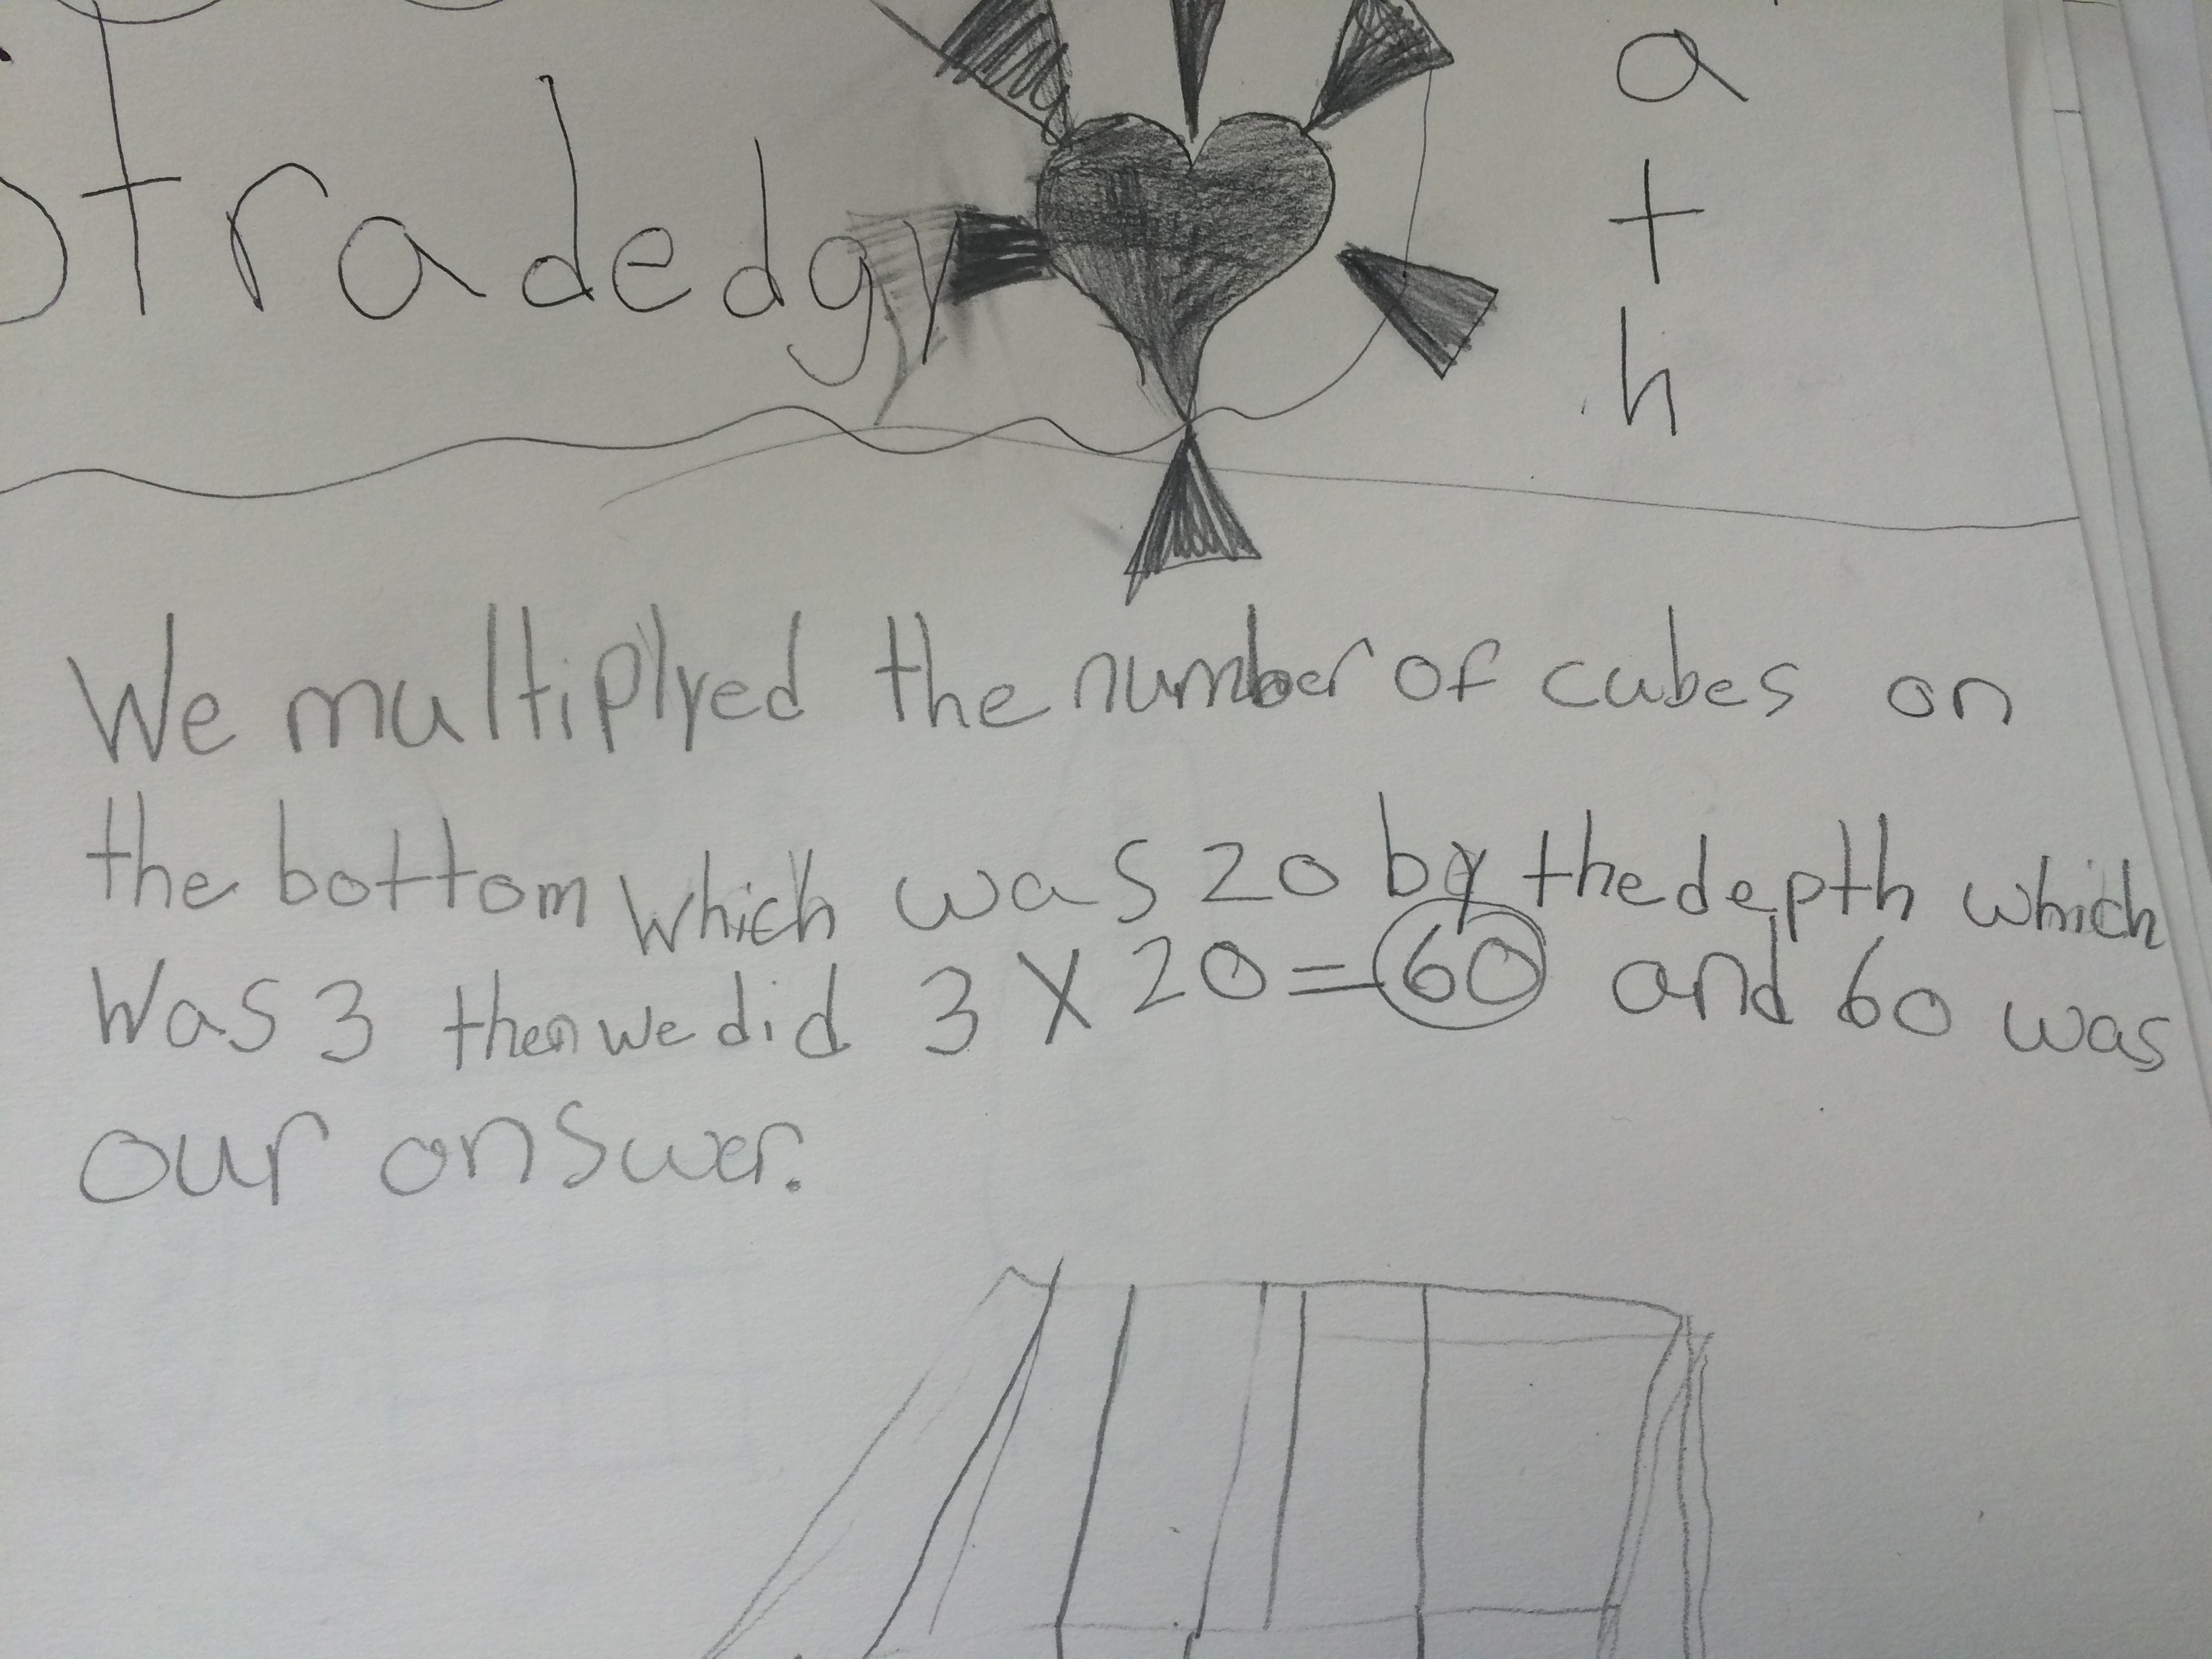
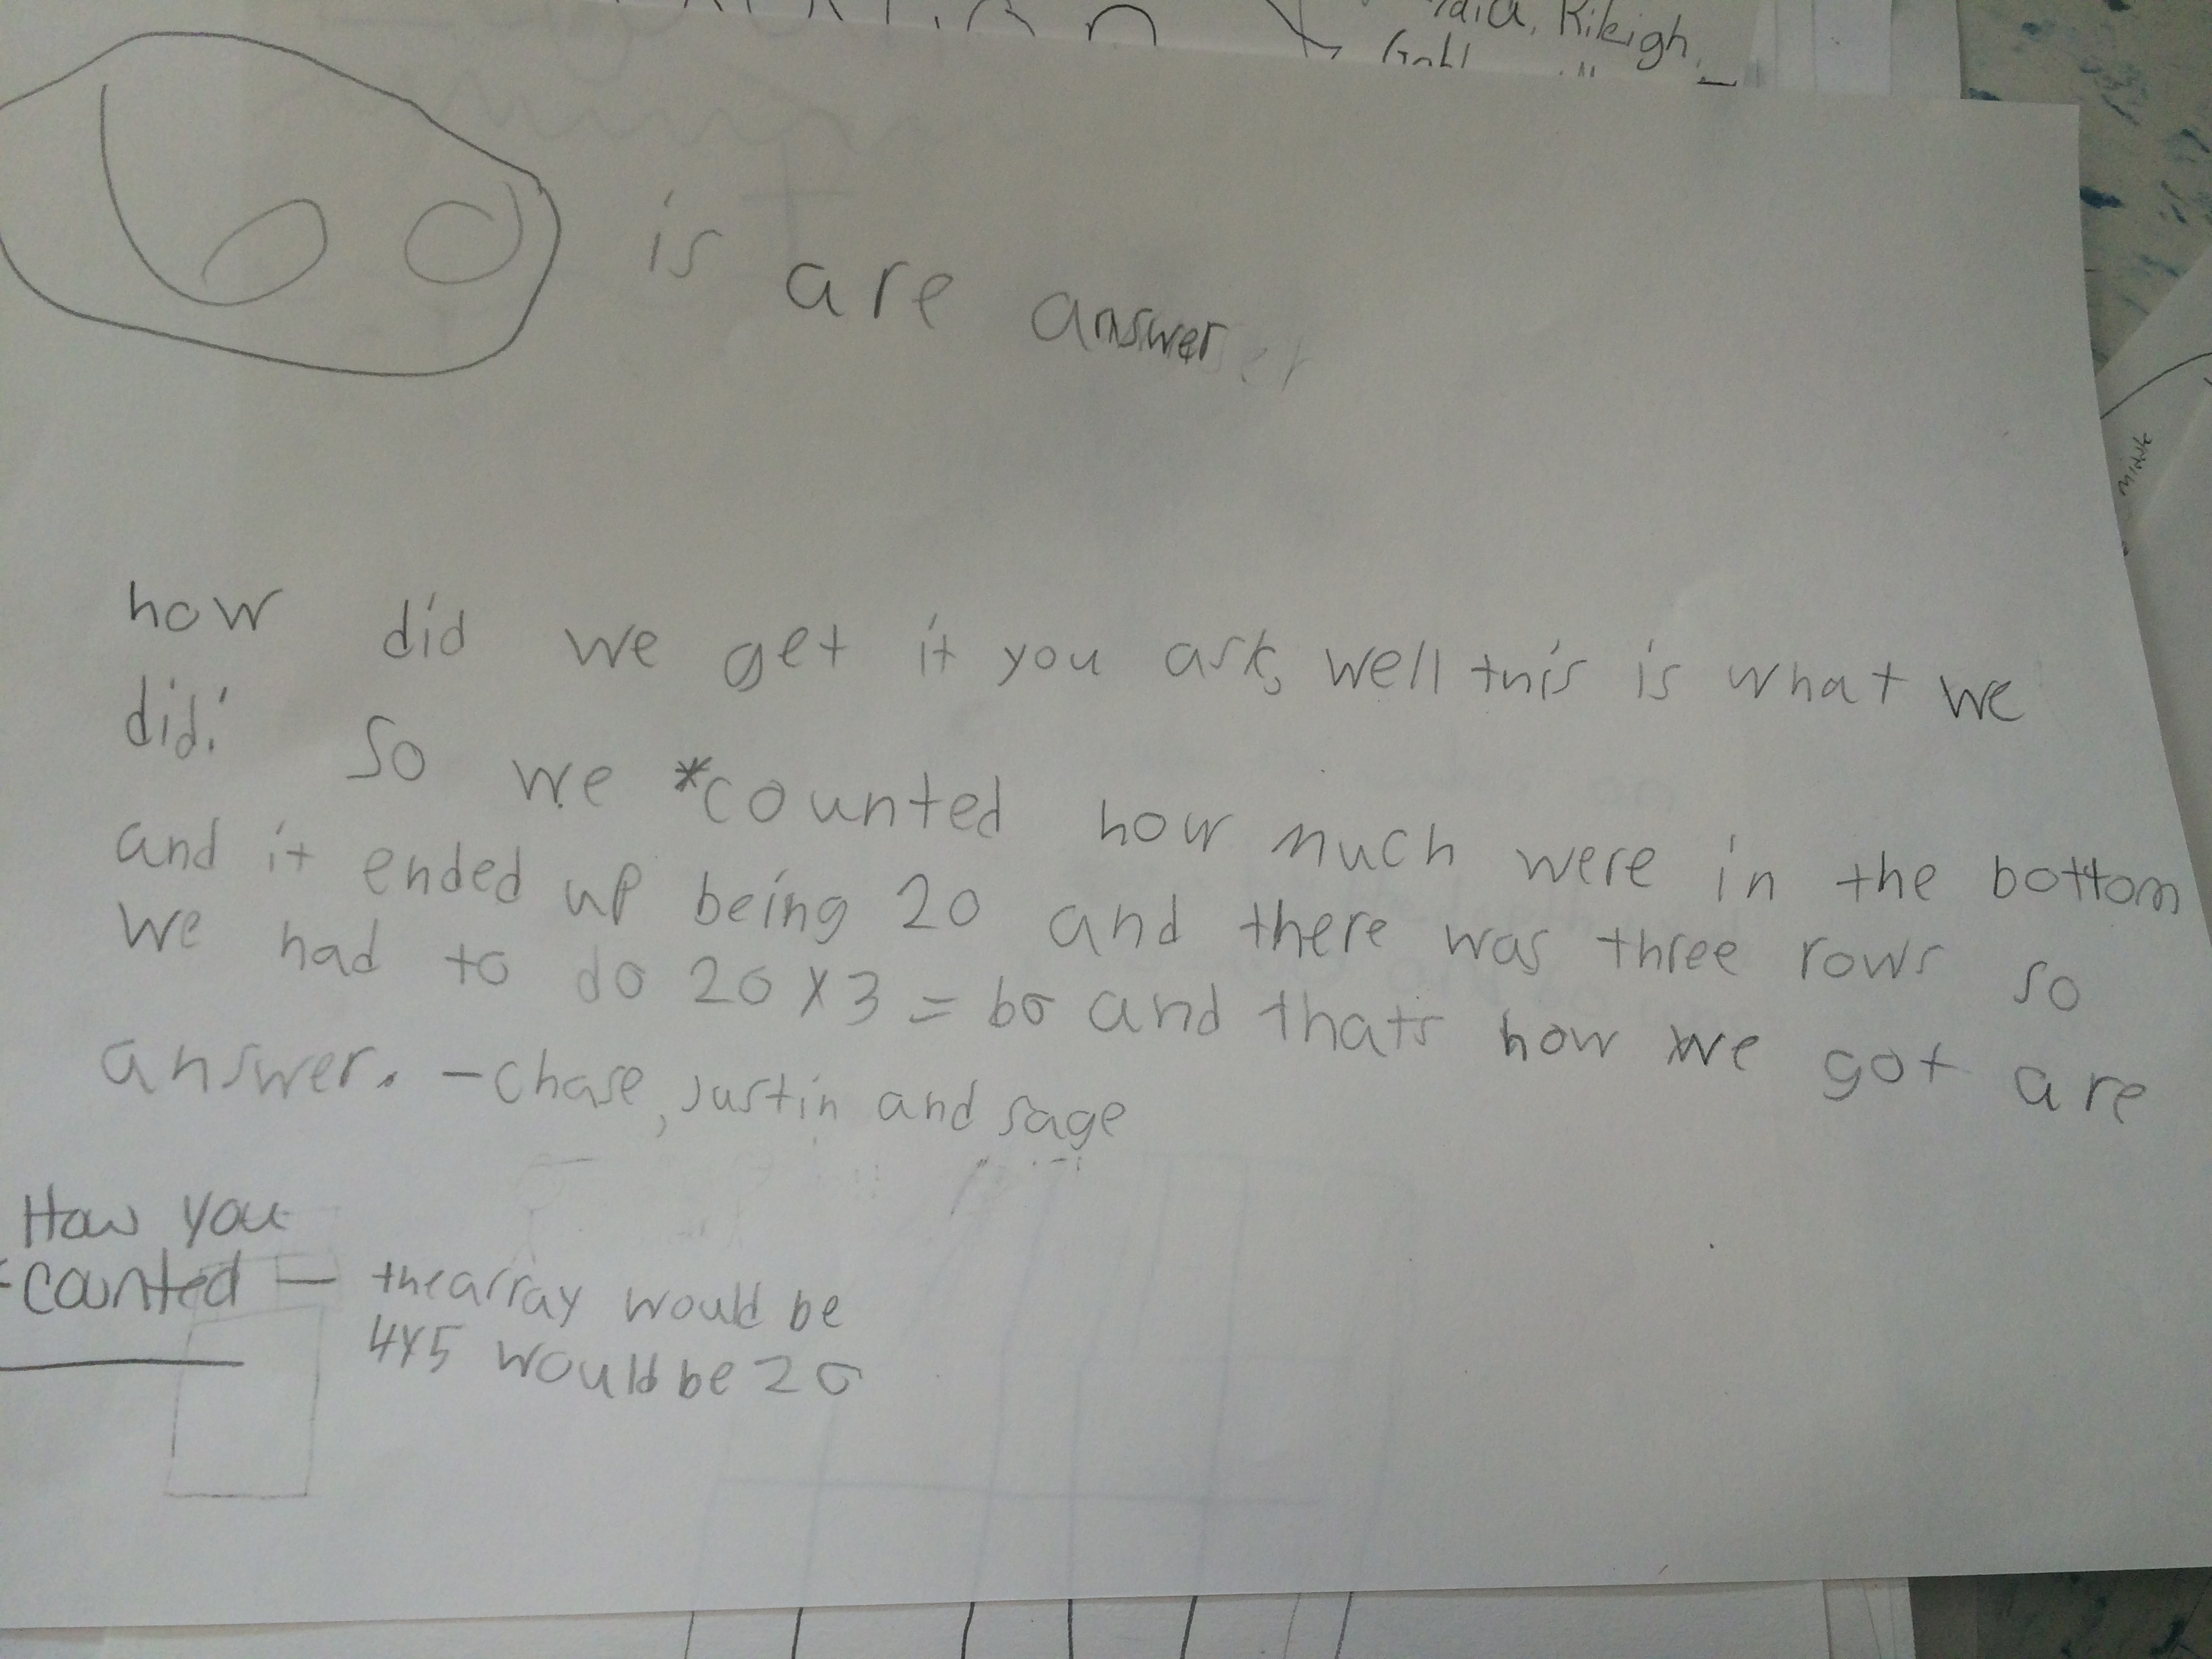
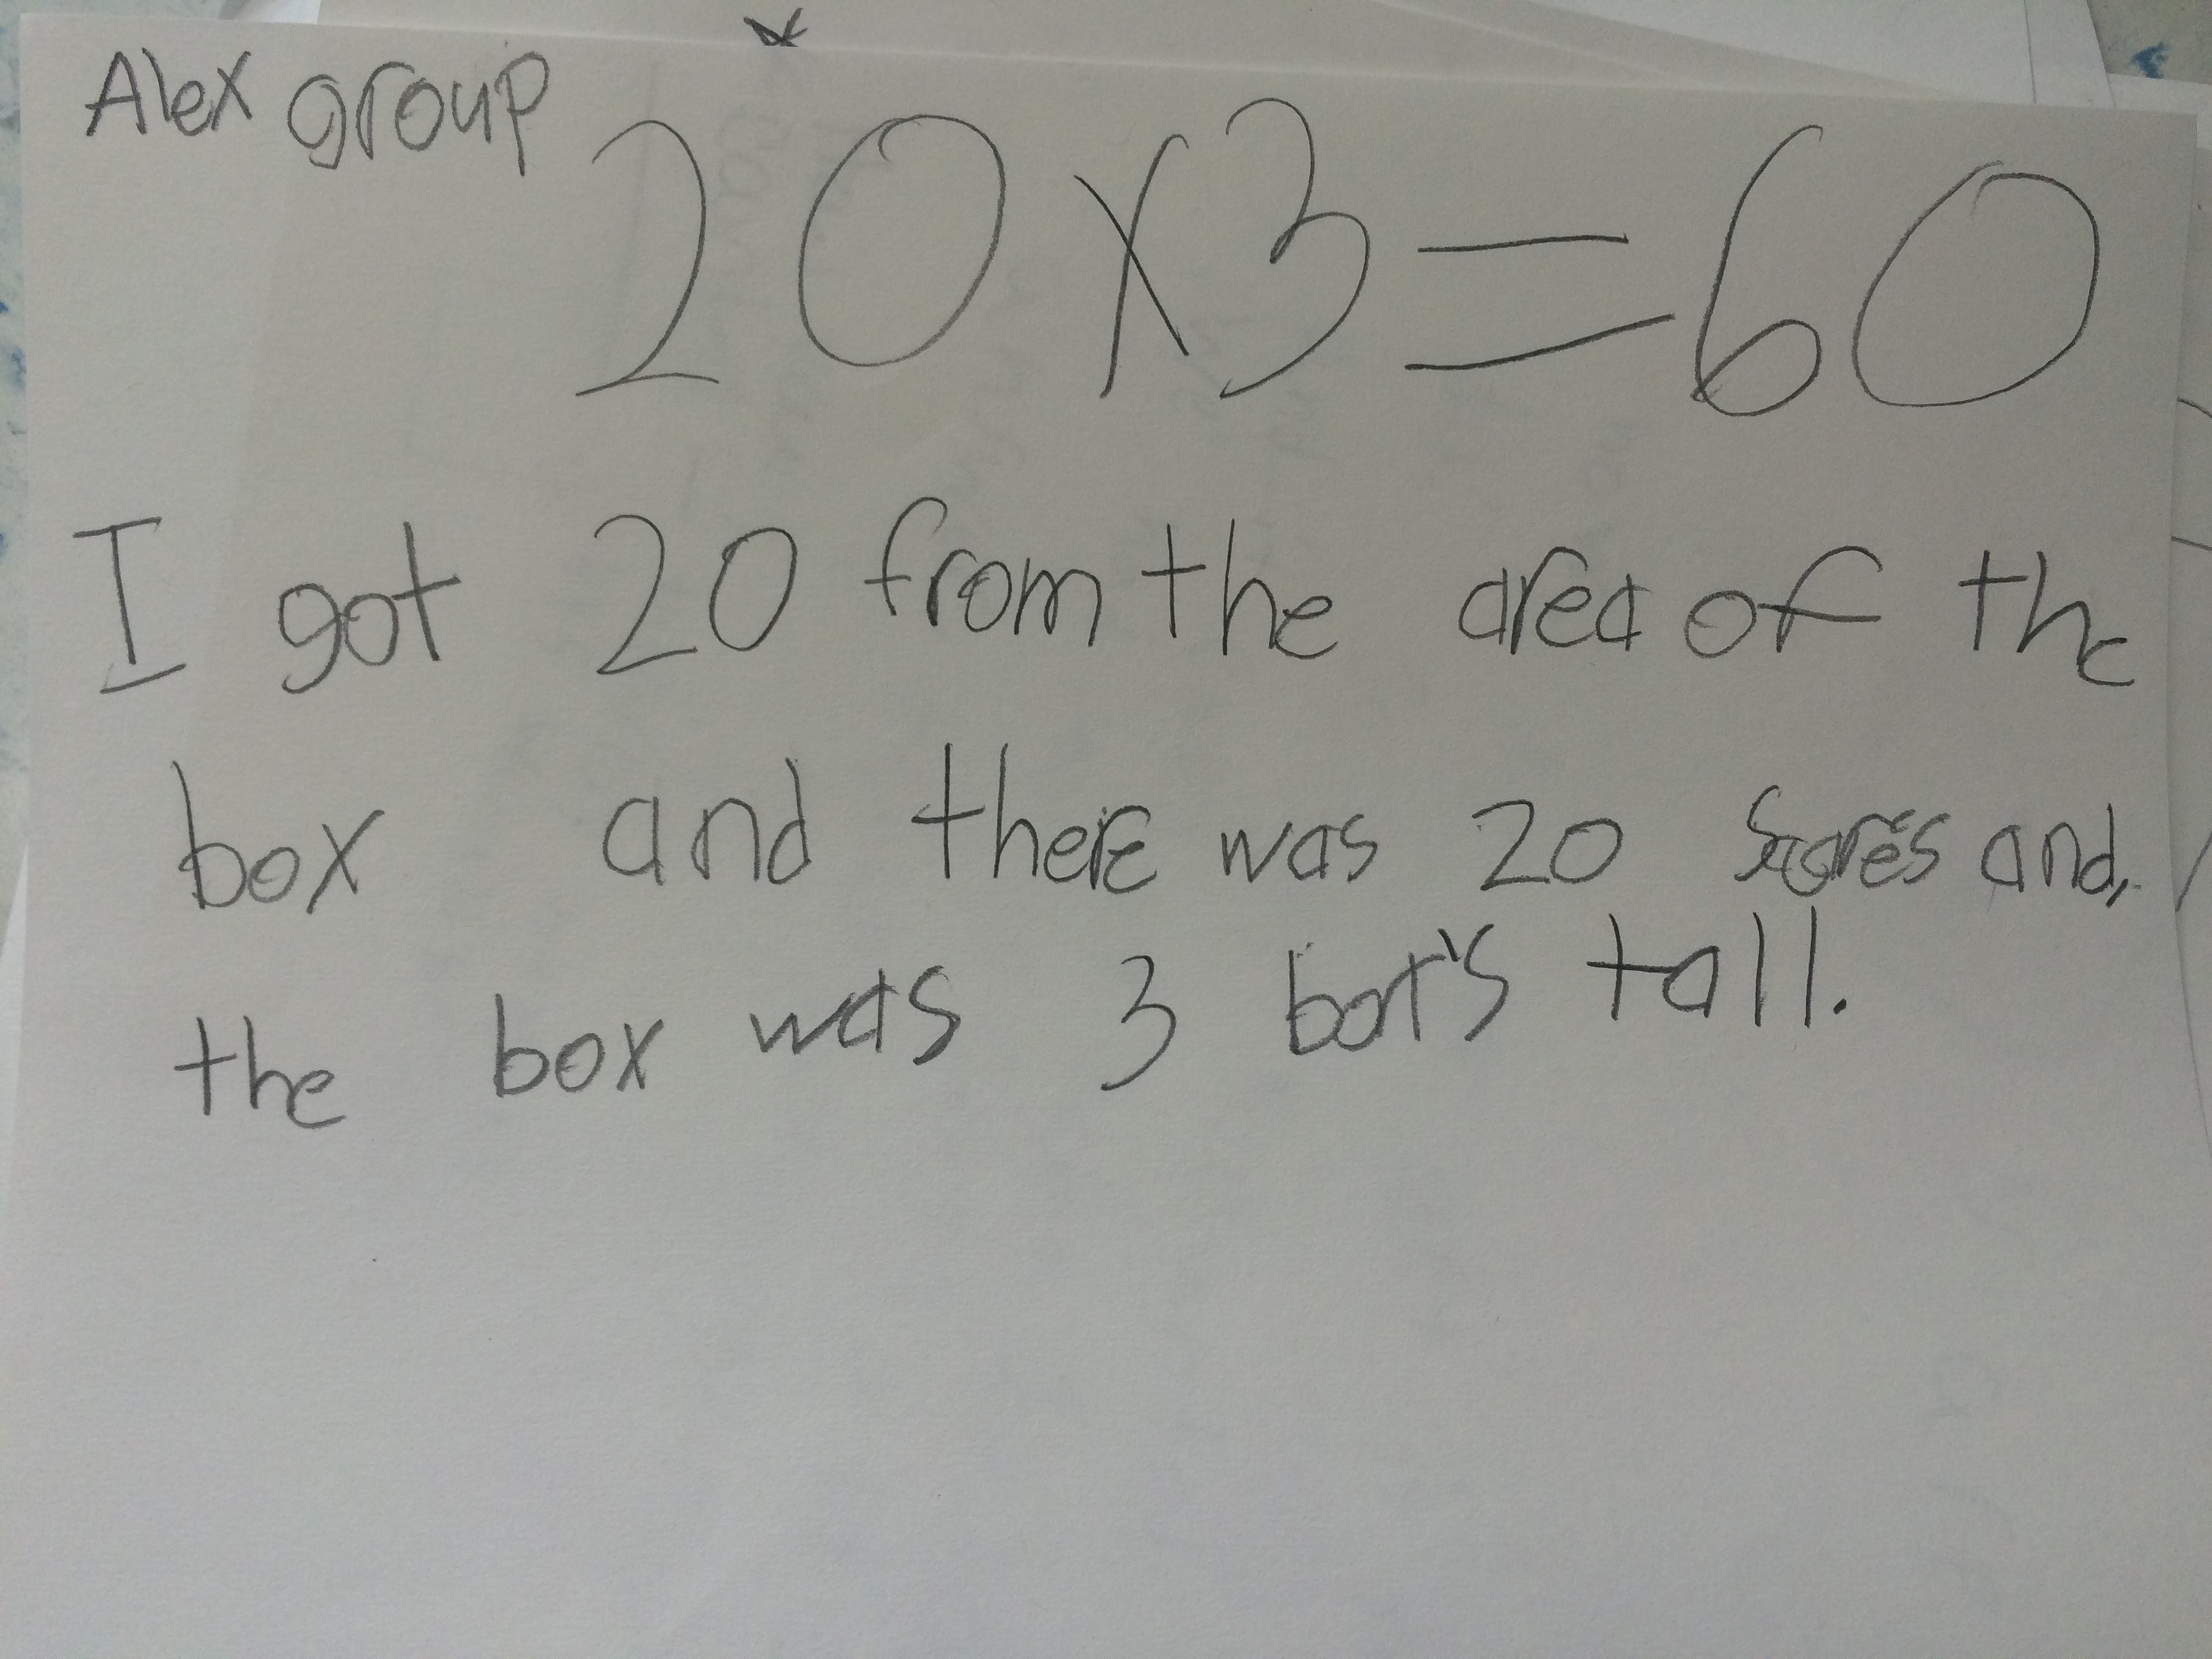
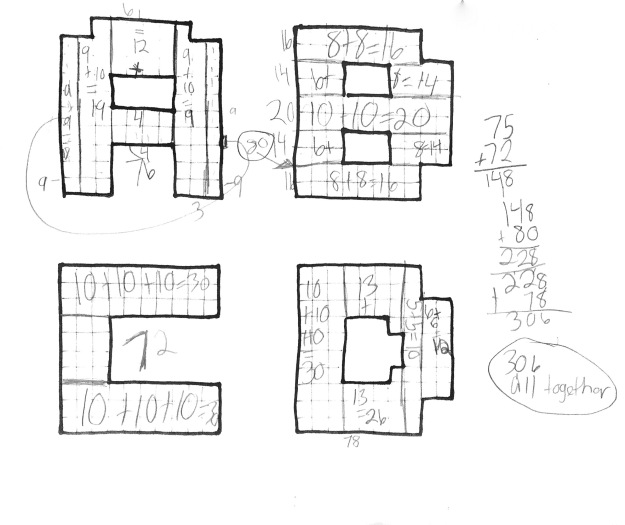
From there, some used a mix of addition and multiplication. I would love to ask these students how they decided where to make their cuts.

Scannable Document 9 on Feb 6, 2017, 6_15_11 PM.jpg

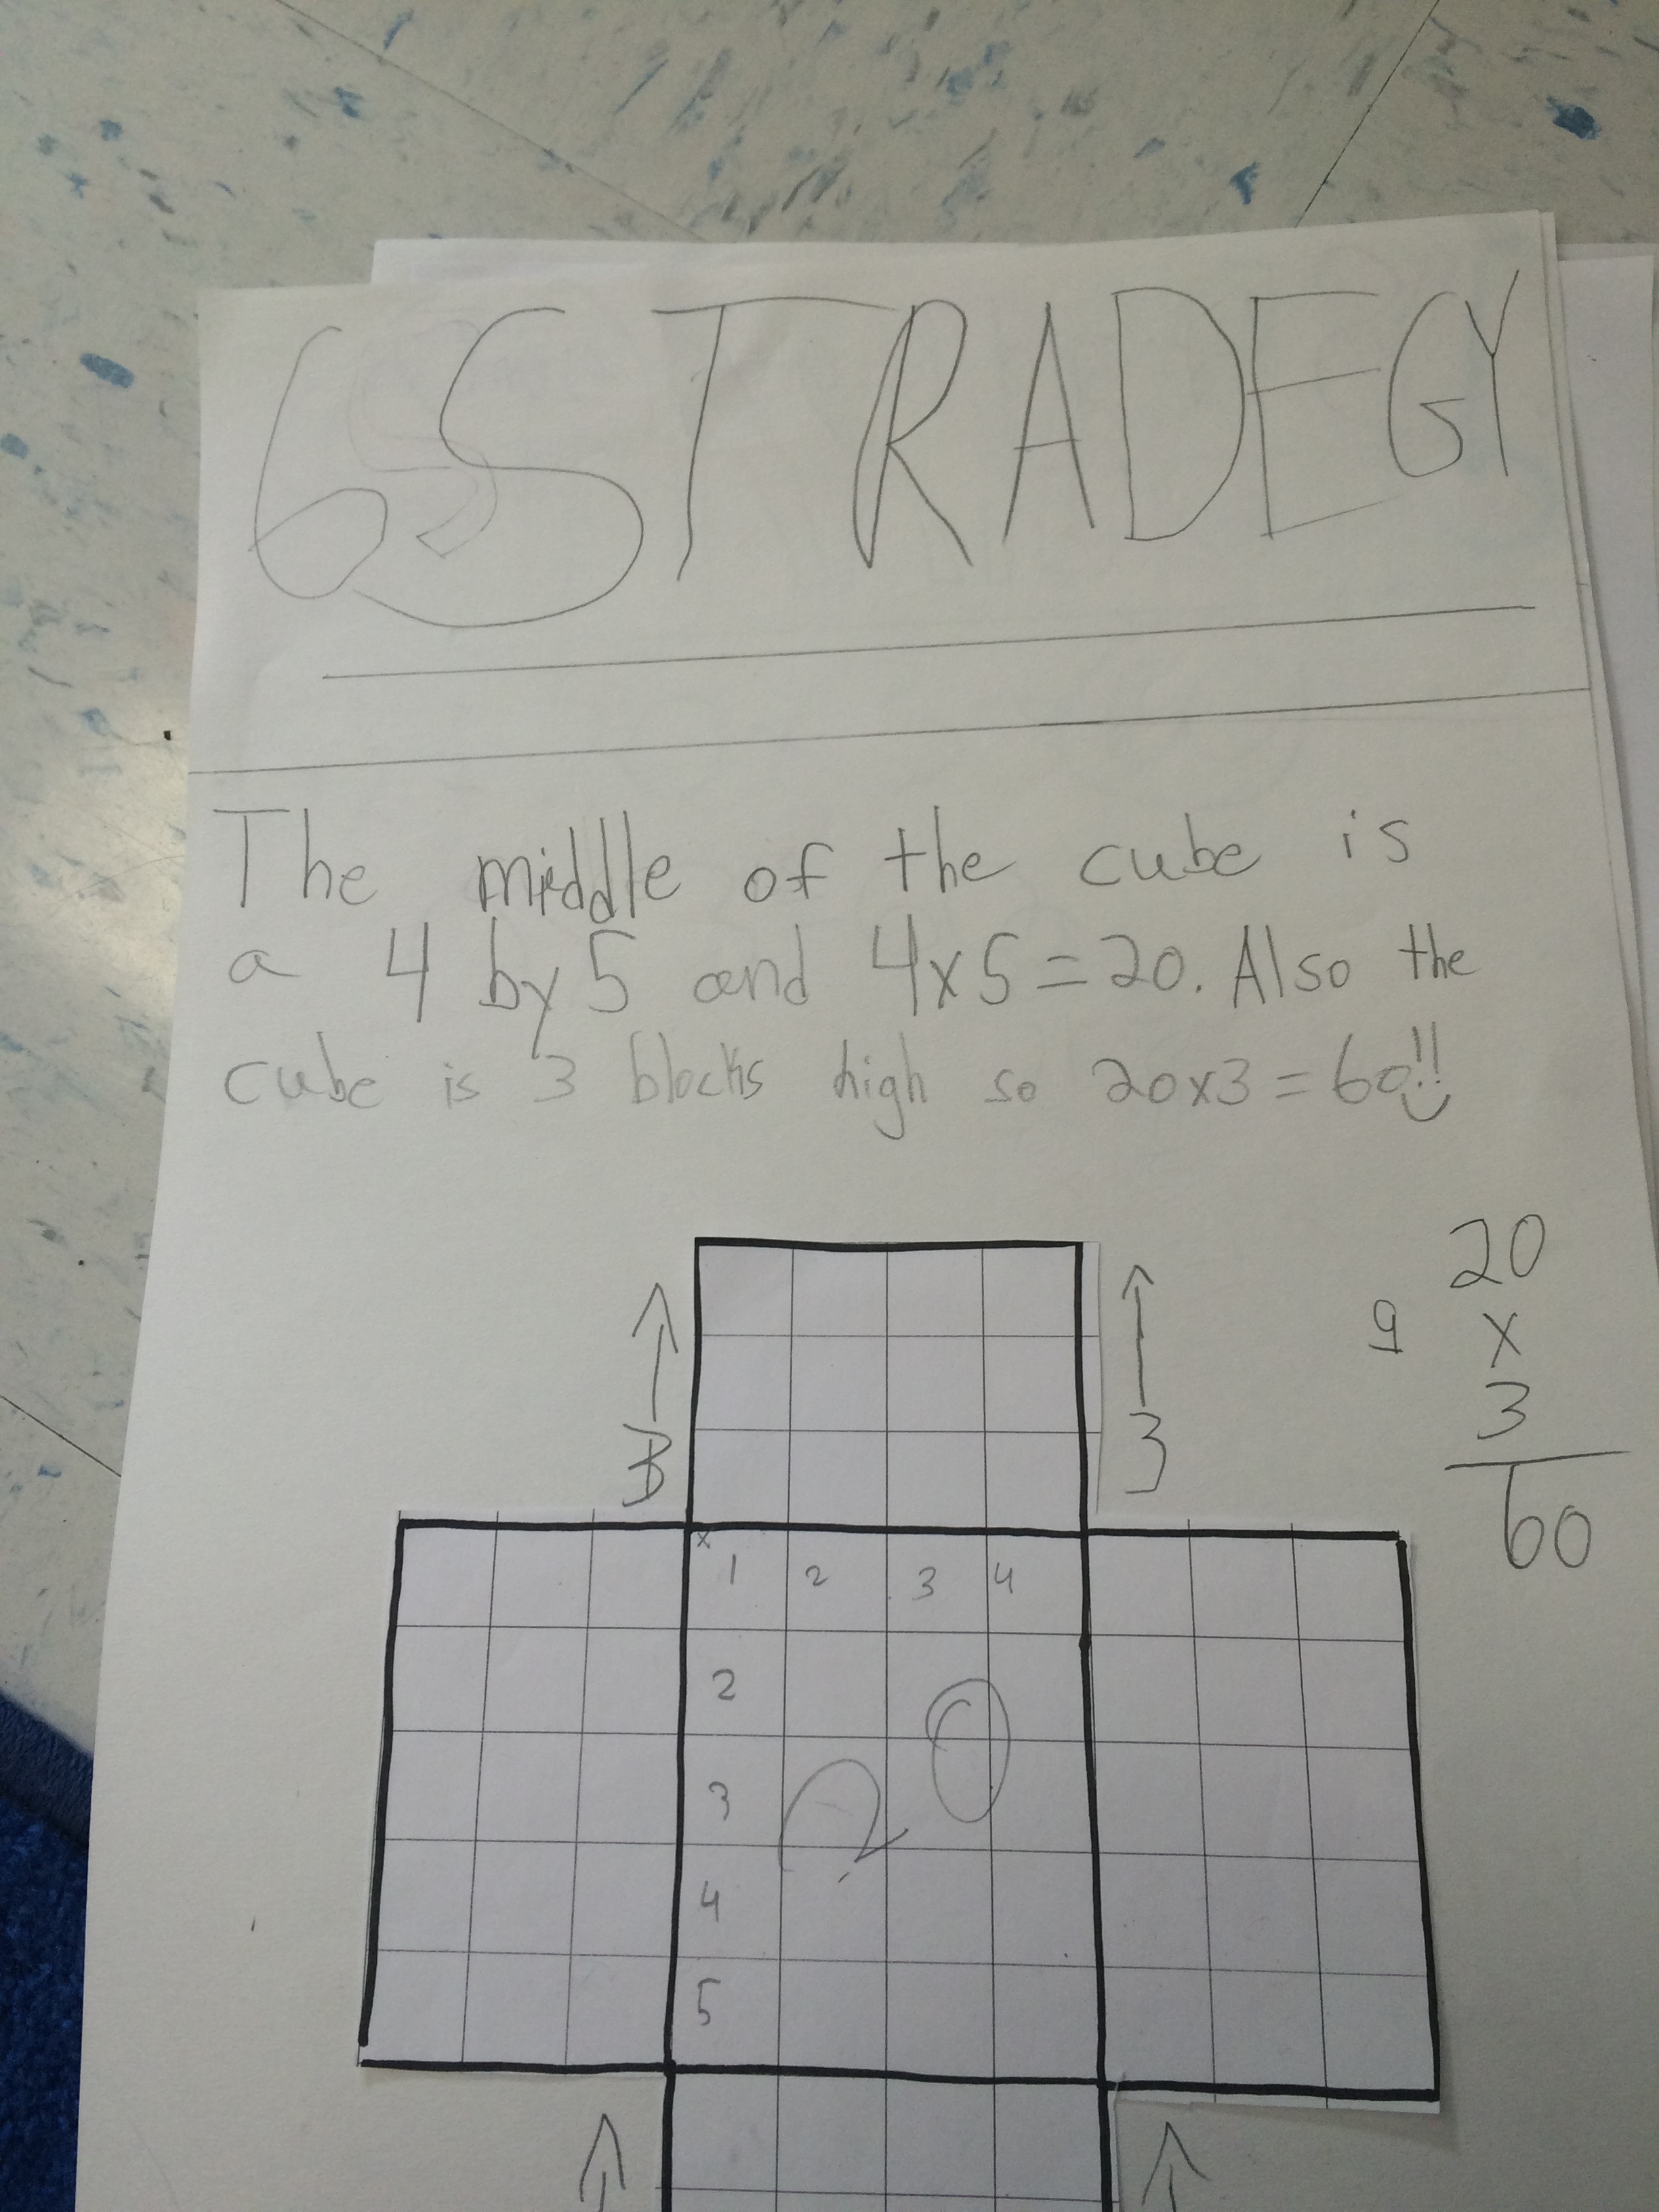
Some students made some larger cuts and I would love to have them meet with the student above and discuss how they decided on their cuts.

Scannable Document 10 on Feb 6, 2017, 6_15_11 PM (1).jpg

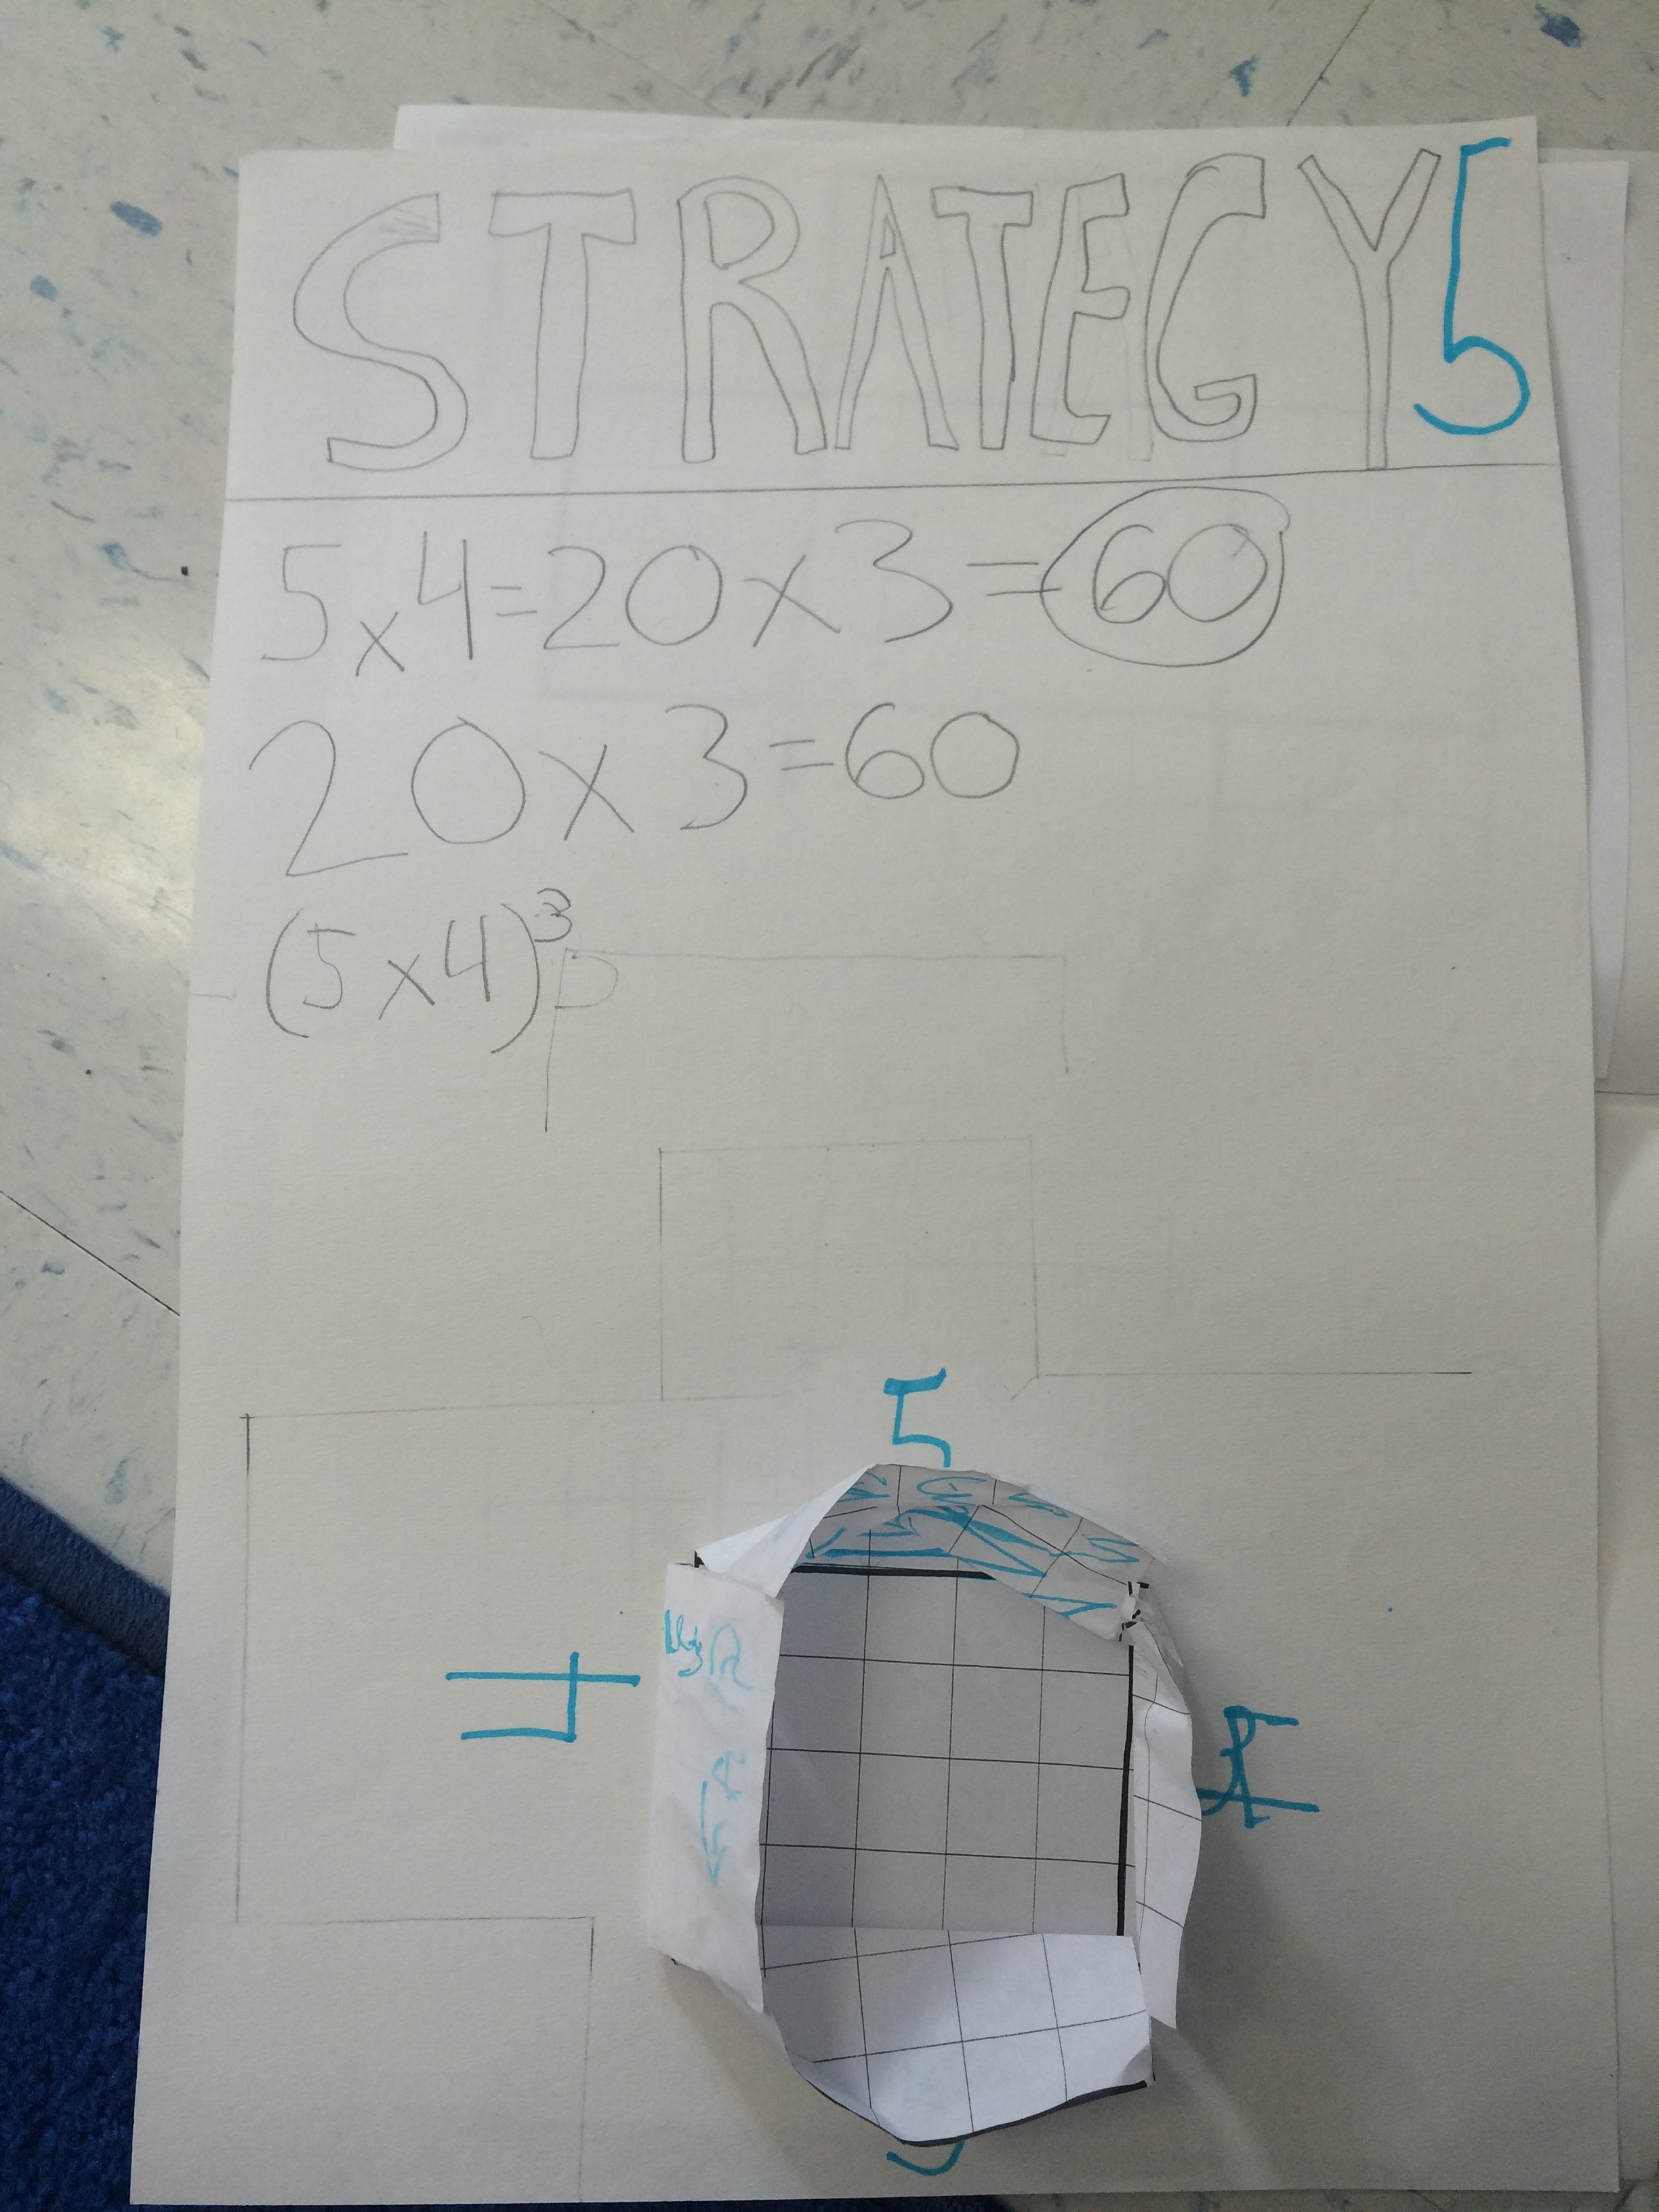
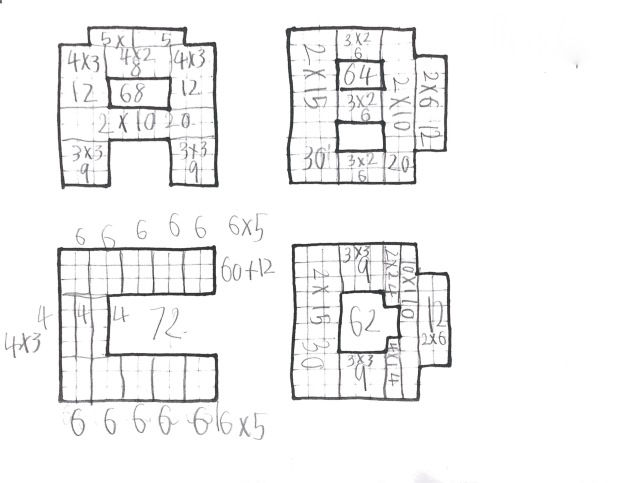
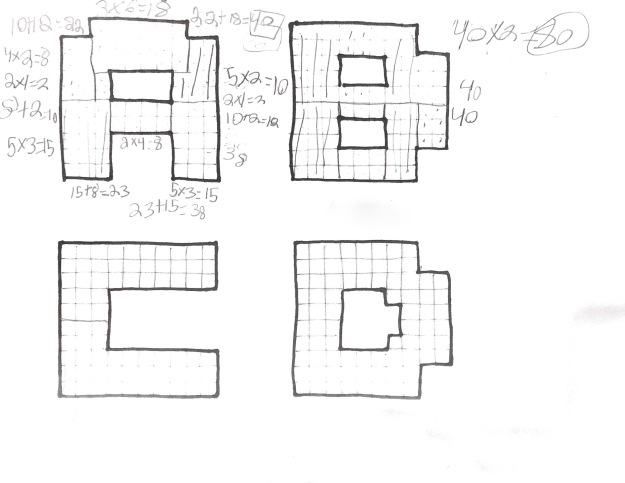
Some used some of the strategies above but also relied a bit on symmetry.

Scannable Document on Feb 6, 2017, 6_15_11 PM.jpg

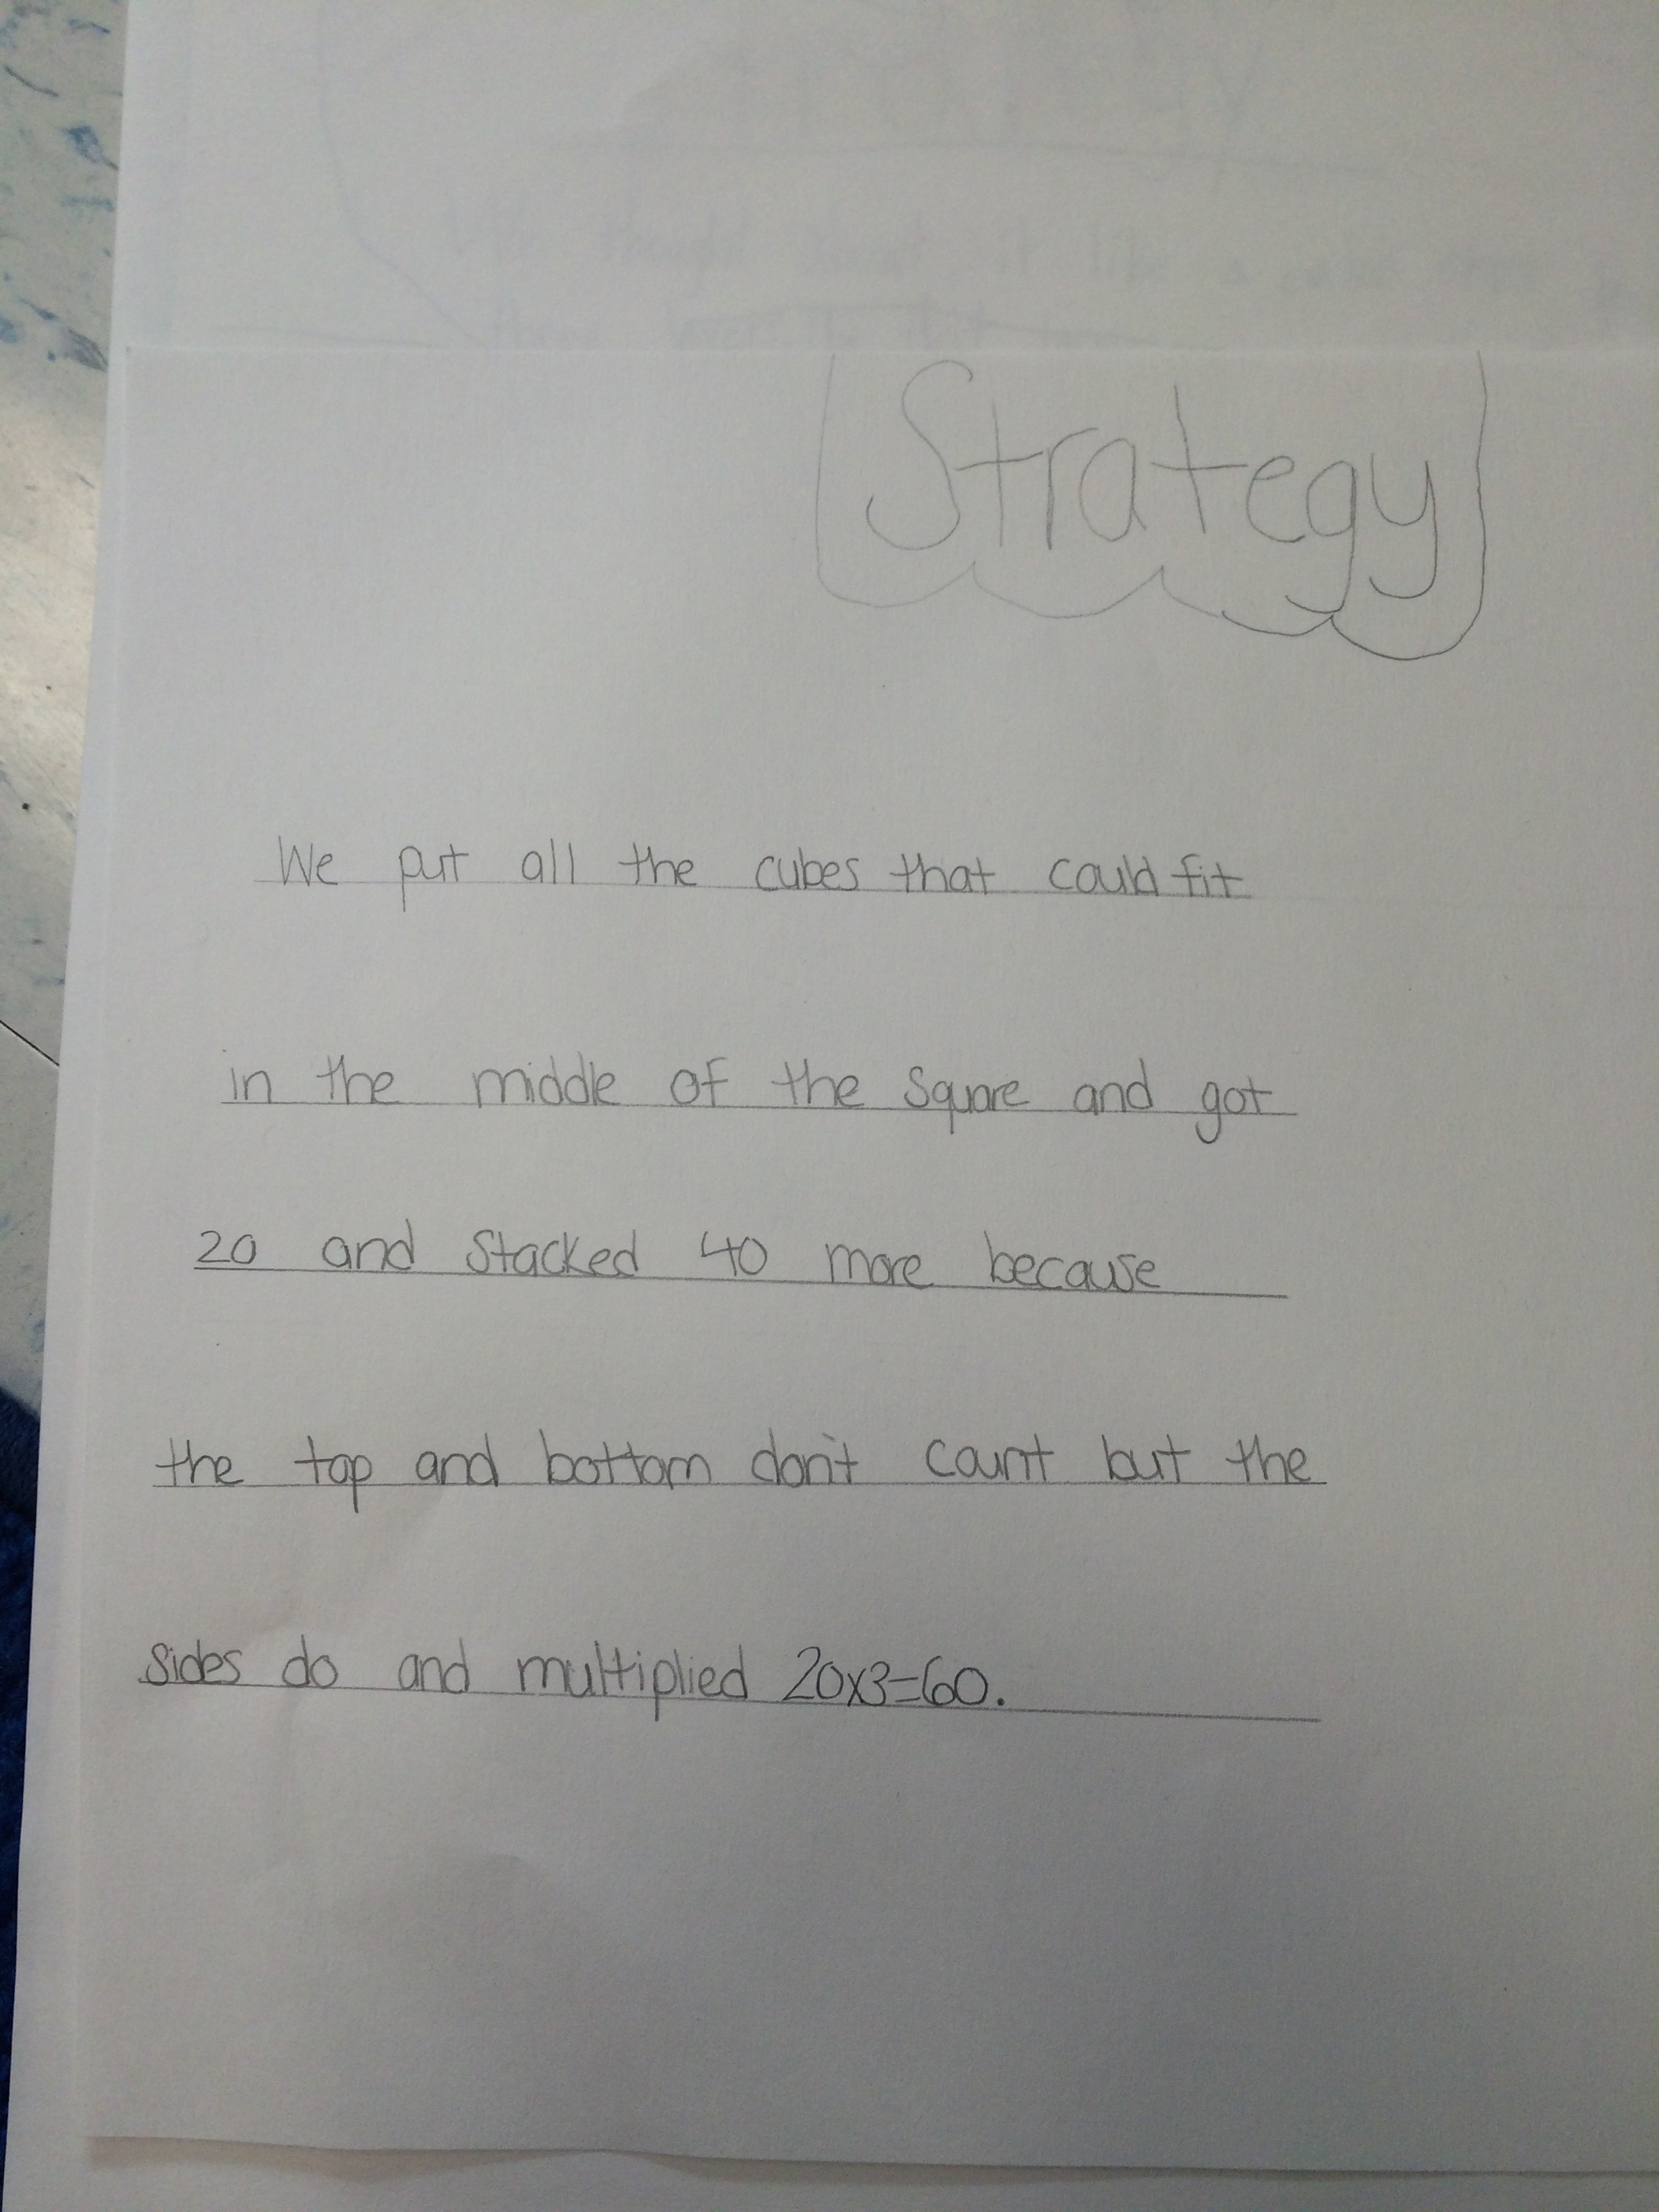
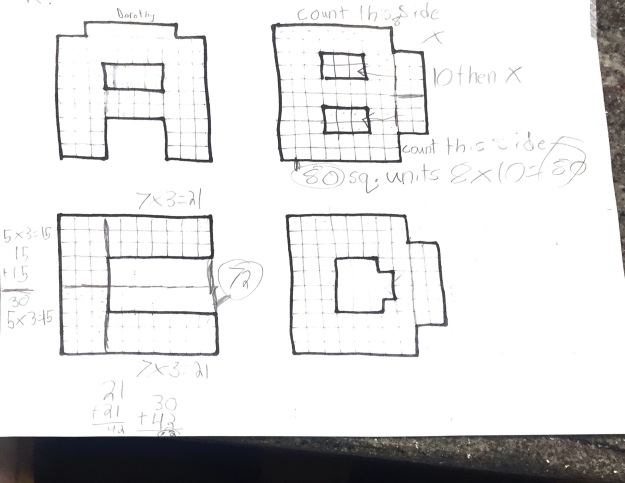
Finally, I saw 2 students moving squares from the “bumps” to the empty spaces.

Scannable Document 3 on Feb 6, 2017, 6_15_11 PM.jpg


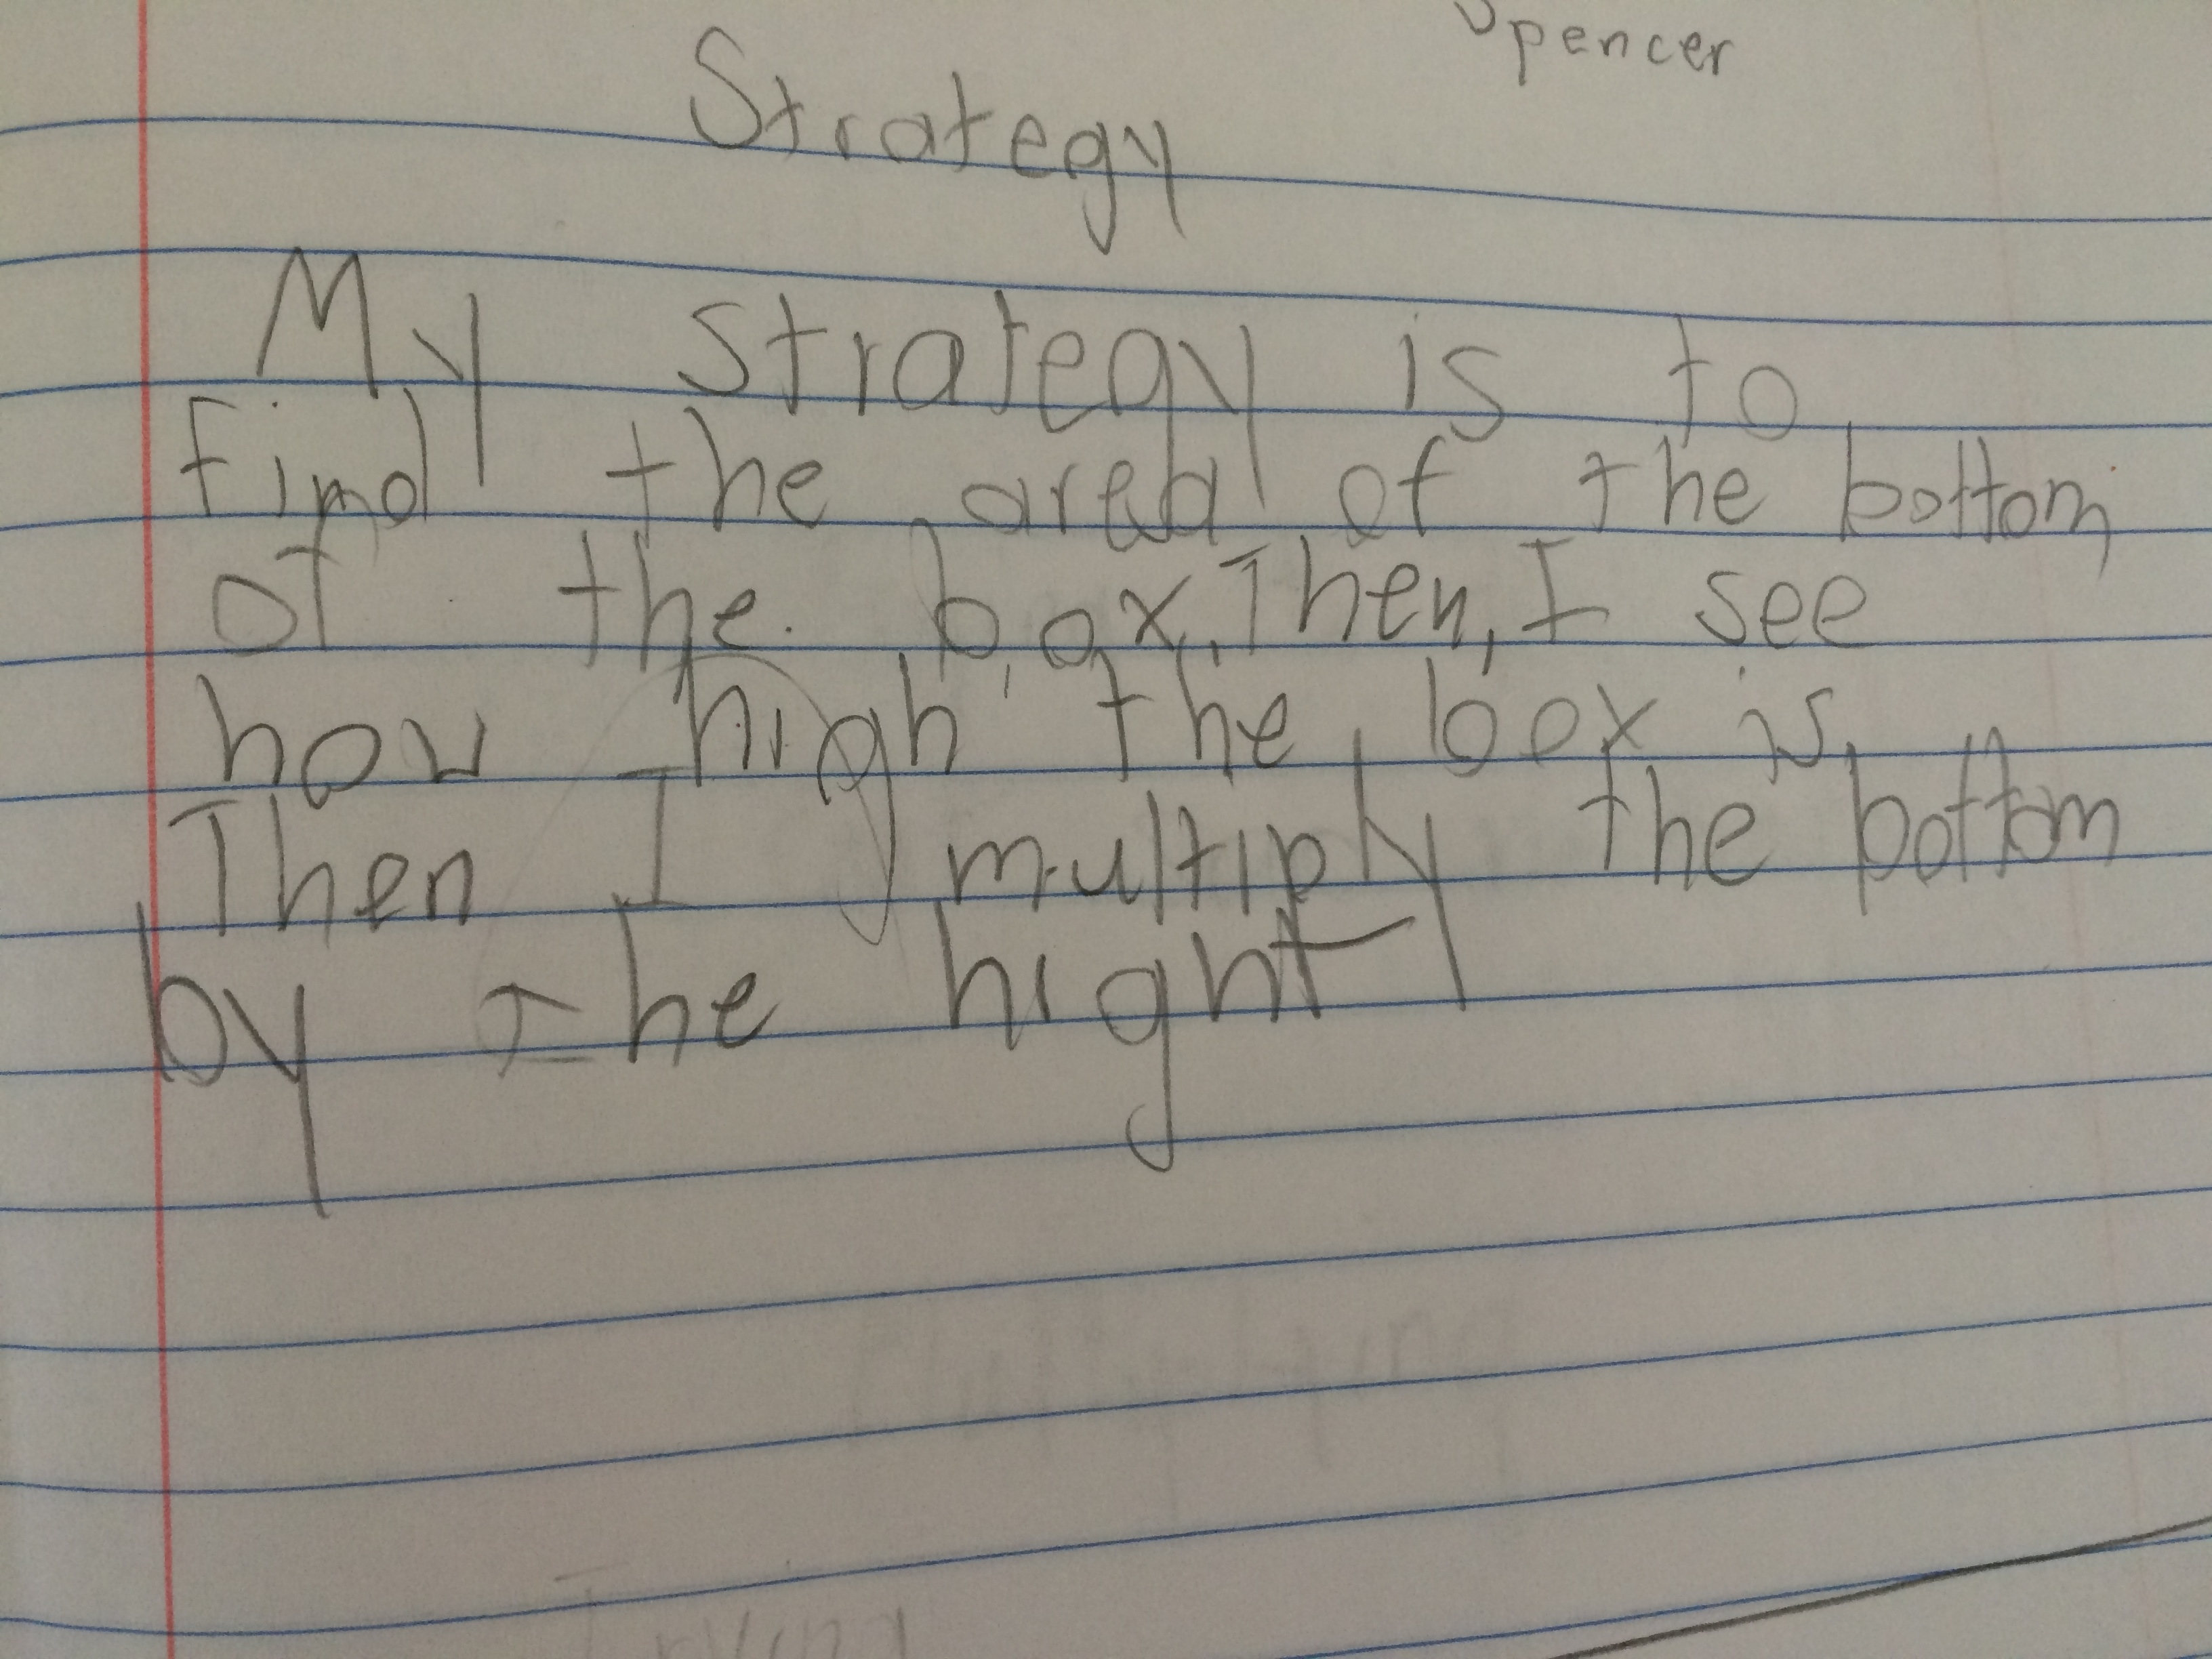
It was always interesting to me that in 5th grade I would still see students find the area of shape on a grid by counting the individual squares even though I know they had better strategies. I think it is the fact that students jump into doing things without thinking about the things first. This is why I think journal writing is so important. It allows students to be more reflective about their decisions.

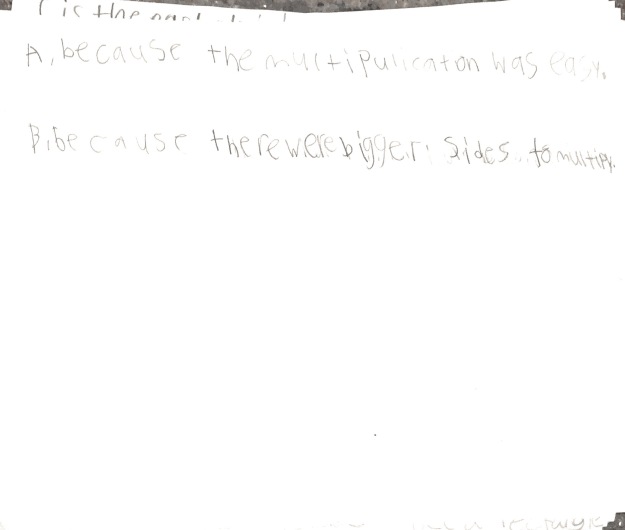
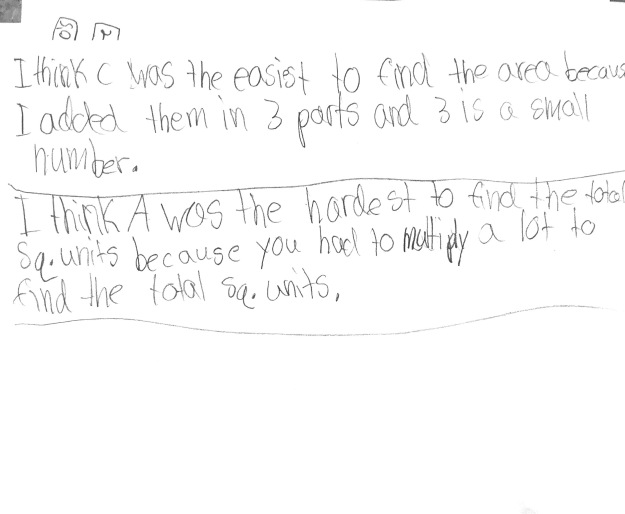
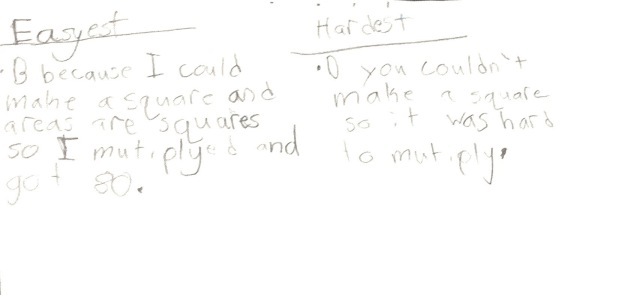
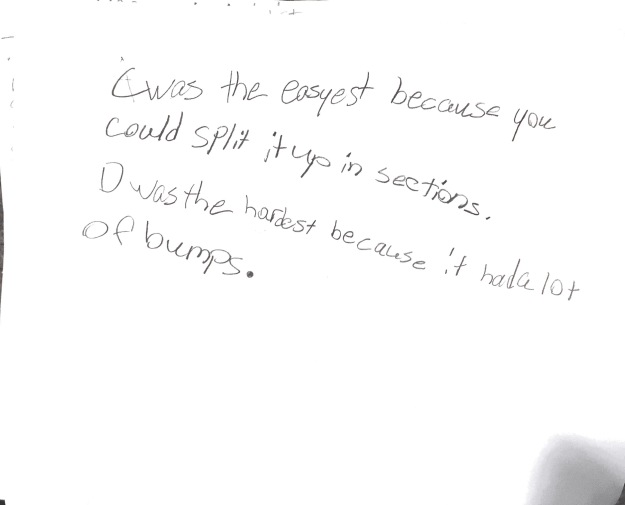
I asked them to write about which shape was the easiest to find the area and which was the most difficult. It was interesting to see some focus on the size of the number they were working with while others focused on the shape and how it could be partitioned.

scannable-document-24-on-feb-6-2017-6_15_11-pmscannable-document-20-on-feb-6-2017-6_15_11-pmScannable Document 26 on Feb 6, 2017, 6_15_11 PM (1).jpgscannable-document-27-on-feb-6-2017-6_15_11-pm

As a follow-up activity, I am going to ask them to choose a letter where they would use the same strategy they used with C and a letter where they would use the same strategy they used with B.


What Is It About These Questions?

Today, I gave the 4th graders four questions to get a glimpse into how they think about multiplication and division before starting their multiplication and division unit. Michael Pershan had given the array question to his 4th graders last week and shared the work with me. As we chatted about next steps with his students, I became curious if the students think about multiplication differently depending on the type or setup of the problem.

Here were the questions:

After sorting 35 student responses I found the following:

  • 17 students got the area question wrong but the two multiplication problems on the back correct. Not only correct, but with great strategies based on place value.
  • 8 students got all of the problems correct, however the area was found in many ways, some not so efficient with lots of addition.
  • 10 got more than two of them incorrect. Some were small calculation errors on the back.

So, what makes almost half of the students not get the area?

Here is the perfect example of what I saw on the majority of those 17 papers:

img_3066 img_3067

Then I did a Number String with them to hear how they shared their mental strategies. I wanted to get more insight into some of their thinking because a few students had used the algorithm on the back two problems.

They did great. They used the 10 and 20 to help them solve the problems and talked about adding and removing groups of one of the factors. I was surprised on the final problem of 7 x 18 that no one used the 7 x 20 but instead broke the 18 apart to find partial products.

IMG_3062.jpg

This makes me think there is something about that rectangle that makes them not use the 10s to help them decompose for partial products. I would love others thoughts and ideas!

————————————————————————–

After reading the comments about area and perimeter, I wanted to throw another typical example of what I saw to see what others think of this (when I asked her she could easily explain partial products on the second and third problem)


Measuring Tools in 2nd Grade

Last week, the 2nd grade team and I planned for a measurement lesson. Their measurement unit falls at the end of the year, so this was actually the first lesson of their unit.

We focused on work on the first of these two standards, anticipating the other would be a natural part of the work as well:

Screen Shot 2016-05-03 at 10.37.50 AM.png

We put out the following measuring tools: square tiles, inch bricks (unlabeled ruler from Investigations), a ruler with inches and cm, and a tape measure in cm.

IMG_2305

The teacher launched the lesson by introducing the “Land of Inch,” a context that Investigations uses in the measurement unit. The introduction involved showing a picture of the 4 places in the Land of Inch: the castle, a cottage, apple orchard, and stable. The students discussed why they thought each one was in the Land of Inch.

Screen Shot 2016-05-03 at 11.22.16 AM.png

On a piece of paper, partners were asked to put the places of the Land where they thought they belonged and measure the distance from the castle to each, choosing whichever tool they thought was appropriate. The only stipulations were that there must be a path from the castle to each and each must be a different distance from the castle.

There were some really cool things that came up as we watched them working:

  • Every group took only the straightedge ruler and tape measure.
  • All of the straight lines were measured with the straightedge.
  • They all noticed the unit difference. We did not state what the unit of each tool was beforehand to see if they noticed.
  • They labeled 12 inches as 1 foot.
  • Students measured the curved paths using both the straightedge and tape measure.
  • Some students wanted to change centimeters to inches because it was the Land of Inch so they lined up the tape measure with the straightedge.

IMG_2307

  • One group recorded their measurements in ranges. They had no interest in starting at the end of the ruler. They just put the ruler down and wrote the two measurements it fell between.

IMG_2314

We wrapped up the lesson asking students to talk about why they chose their measuring tools. We had planned for them to share these ideas before they did a different journal prompt we designed last week. However, as they were sharing, there were one or two students doing a lot of talking (great stuff, but a lot) so we decided to have them reflect on their own before having this conversation.

IMG_2312.jpg


This student did a great job of explaining when they used one tool over another:

FullSizeRender 48

This student discussed why they chose to use the ruler but not the square inch tiles at all because it would take too long. So while both tools were the same unit, one tool has connected units versus individual units that need to be put together.

FullSizeRender 47

This group noticed that the centimeters (on the tape measure) would take them longer than the straightedge because there were more centimeters than there would be inches.

FullSizeRender 49

There were a couple instructional prompts we are revising for the next time this lesson gets taught by one of the other 2nd grade teachers that were there:

  • We didn’t let them know the paths didn’t have to be straight until after we saw them get started that way. Need to launch with that.
  • We didn’t have out meter or yard sticks, oops, need those next time. Talked about it during our planning, but we completely forgot.
  • We didn’t do a poster share which I think we want to incorporate next time because they all wanted to share. So maybe just two groups explaining their choices.
  • Wondering about the writing connection as they all had interesting reasoning behind where their places were located. Could they write a description about the placement and reasoning for their poster and then have other partners try to match them up?

Next up, reading Inch by Inch and the lesson inspired by the TCM article Inch by Inch in the most recent publication.


3rd Grade Perimeter Part II

Last week, I posted about a 3rd grade lesson I planned and taught with Hope and Lori. We did not get to everything we planned so I love that they filled me in on what happened the next day when they continued the work! And when the continuation involves looking at student work, I love it even more! That said, this will be a bit of a student work-heavy post with things I noticed and wondered in steps moving forward from here with the students…

After measuring a piece of paper in the previous lesson, we wanted to ask students how they would find the distance around any-sized piece of paper. In giving them the journal writing, we wanted to have them reflect on the measuring and calculating they did in a more general sense and see how they put the process into words. Most student papers resembled the explanation in piece of work below:

IMG_1586

It was really interesting to find most students drew a picture to illustrate their explanation even when not asked to do so. To me, this is a nice mix of show your thinking and show your work. In reading this example below, this student is thinking a lot about conversions and I think, moving forward, the class needs to have a discussion about combining different measurement units.


The mix of units shows up again below. I can see they probably chose centimeters because they didn’t have a smaller unit than the inch and didn’t know how to name the measurement in inches. I love the “not really the size” but I wonder about the border look of the perimeter. Is this student seeing the 6 inches and 3 cm ending where the line is and counting boxes instead of the distance around?


This one is an amazing look at how the formula we all know, and probably had to memorize, arises in third grade. The calculation on the back was equally as nice. This is an example of something during a class share that I would show last in a progression to compare with the previous strategies as it does a nice job of showing the process of finding perimeter in two ways.


This one was so interesting because it involved a square and a circle. The measurements on the back were most intriguing and I have so many questions for this student. Like, how do you know that is a square? (because the sides are not the same length) Where is the 1/2 coming from in your answer? (because I cannot tell where he is stopping and starting his measuring) and Why did you want to cut a circle and a square?


Then, Hope asked them to draw their own ant path and some really interesting things came out that will have to be a blog post in and of itself! There are things we didn’t think about in our question and some things we really need to think about moving forward. Like…

Could this student start thinking about area? Why did the choose to draw a non-rectangular path?

IMG_1568

Where are the measurements for each side? Why did you label them where you did? Why did you choose to use inches and centimeters?

IMG_1575

When did you choose to use inches and when did you choose centimeters? Could you have measured it all in inches? all in centimeters?

IMG_1571

First, the fact the student sent the ant to Walmart is too funny:) I would love to ask this student how he or she added all of those side lengths? and Why was it longer to get home from Walmart than it was to get there? Could the ant have walked the same distance there and back? How?

IMG_1573

On this one, we did not anticipate students’ ants taking the same path back that he did out. So this is important to think about distance and versus distance around something.

IMG_1570

Oh, an isosceles right triangle, how fun! I would love to ask this student about this perimeter in centimeters because of the diagonal cuts in the boxes. A lot of students counted the diagonals as 1 unit like they did for the sides of the boxes, so would that work out if you measured it with a ruler in centimeters? Why?

IMG_1574

My question is where to go with a student who is here? All teachers face this, right? There are some students who conceptually and computationally have a grasp on an idea. This student can obviously find perimeter and is very comfortable with the computation piece of it, so what do you ask him from here? Do you give him things to measure that closer to  a quarter and see how he works with the fractions? Do you ask him if his strategy will work for every shape? (I lean toward this one) Do you ask him about non-rectangular polygon areas? Do you do anything with area at this point? So much to think about!

IMG_1569

~Kristin

2nd Grade Learning Lab: Data

Last week in our Learning Lab, the second grade team and I planned for a lesson within the data work they are currently doing in Investigations. We spent a lot of time the previous week revisiting the Learning Progressions  and the focus by grade level document at Achieve the Core while also discussing the addition work, involving grouping, from their most recent math unit.

Since the students have been doing a lot of work constructing bar graphs, we wanted to move past the polling and construction piece that their unit spends a lot of time on, and make more connections to all of their recent number work.

We chose this image to be the focus of the lesson:

CTGDOKCXIAAZpCs.png

I found this graph on Brian Bushart’s awesome blog 

We chose this image for a few reasons:

  • The rain was in groups of 2 which we thought related really nicely to their most recent addition work.
  • The half box was really interesting and we wanted to see how students dealt with it.
  • The bars were horizontal as opposed to the vertical bars they have been using in their bar graphs.
  • It lent itself to a variety of questions involving comparisons with larger numbers than their classroom graphs they have been doing.

Now, what to do with this image? As we talked about different questions we would want the students to be able to answer about the graph, I threw out the possibility of having students generate the questions after they do some noticing. It was such a fun teacher conversation as we looked at the graph through the eyes of a student and brainstormed questions that could be elicited from the graph. During our brainstorming, we paid careful attention to the type of problem the questions would elicit:

  • Join problems involving combining numbers within one bar. This would be a nice connection to the adding by groups they have been working on in class. For example, how much rain did Waco get? Students could count by 2’s or count five boxes as 10.
  • Join problems involving multiple bars. For example, how  much rain did all of the cities get altogether?
  • Comparison problems involving two bars. For example, how much more rain did Austin get than San Antonio?
  • Most and least questions. For example, who got the most rain?
  • Combination of Join and Compare problems. For example, how much more rain did Georgetown and Waco get than Austin and San Antonio? (This may be a stretch;)

The day of the lesson, Lauren launched the lesson with just me in the room and the other teachers were scheduled to join us during the question-generating time. We thought that would be the most interesting section to see since we only can find coverage for @20 minutes for the teachers.

The students did great noticings in their groups and Lauren and I were feeling really confident that the students could use these noticings to generate questions to match them.

After sharing as a whole group, Lauren prompted the students to begin thinking about what questions they could ask about this graph.

Blank stares.

We were a completely surprised because we though for sure they could work their way backwards from their noticings to create the question that it would answer. At this point we had the entire team of second grade teachers in the room and we began discussing how to clarify the directions. After one teacher prompted the students to think about “question words,” we decided to let them start working in their groups.

This is the point of the lesson where I realized a component I needed to add to our Learning Lab planning, teacher role during group work. This was our first time having everyone enter during the group work portion of the lesson and while there were great conversations around the room, it was hard to tell how much was students interacting with one another or with the teacher at the table. I think this came about because we could have done better in planning our directions for the students so, as a result, everyone was trying to clarify the directions at the table with the students.  In the end, Lauren’s students did finish with a lot of the same questions we anticipated and many questions they could solve the following day:

IMG_1402IMG_1404IMG_1405IMG_1406

We had planned for students to choose one of their questions and show how they would arrive at their answer in their journal, but the question generating took a bit longer than expected!

Two things I am left wondering:

  • In regards to Learning Lab planning, how would we have defined teacher interaction within the groups? Would we just be taking notes on what students were saying/doing? Would be asking students to clarify their thinking? Would we be answering questions they tried to ask us? Should we all be doing the same thing to be consistent in our debrief?
  • In regards to the math, how do students work backwards to generate questions for a given image? Would rephrasing the directions help them think about it differently? If we asked them to create a quiz for the teachers based on the graph, would that have helped? How is wondering about an image different than generating questions for it?


Finding Angle Measures

In our 2-D geometry unit, we have been classifying polygons based on attributes of sides and angles.  This week, the students were using what they know about angle measures and polygons to find the measures of other angles.  These are the polygons students were working with:

0001

The first day, I put polygon F on the whiteboard and asked tables to develop a proof for the angles in F. I was excited to see they had worked with this in 4th grade and were comfortable in being able to prove it was 90, 45, 45. Here are a couple of the proofs from that day’s work…

IMG_8423 IMG_8422IMG_8417IMG_8457

It was interesting to my colleague and I to really think deeply about what the students were saying in their explanation. We had to ask ourselves if they were really thinking about the angle itself when they were saying “A triangle is 180º because it is half of a square which is 360º.” Their proof with the polygons looked like an area model, so were they thinking about the angles or thinking that the area of the triangle is 180?

In the next activity, I really wanted to focus on students composing and decomposing the angles themselves. They worked in groups to find the angle measures of the remaining polygons on the above sheet. Here are a few of their proofs that we shared as a class.

IMG_8458 IMG_8459 IMG_8460  IMG_8462IMG_8461

After sharing our proofs today, I felt very comfortable with student understanding of finding missing angles and thought it would be interesting to move into construction of these shapes in Hopscotch (a coding app). This is one of those things that is not explicitly in the curriculum, but something I just think is so great for students to explore. It is wonderful for students to see angles as turns and explore supplementary, interior and exterior angles.

We practiced making a square together to be sure everyone had an understanding of how the codes worked and then I sent them off to build the triangles. You can imagine the surprise as they punched in 60º for the turn to make an equilateral triangle and the character shot off in the wrong direction. I let them work their way through it and then reflect in their journals after. Here are some of their thoughts…

IMG_8451 IMG_8452 IMG_8453 IMG_8454 IMG_8455 IMG_8456

They left me with so much to think about for Monday’s lesson. I love the idea of a negative number makes them turn the other direction, the relationships to 180º, and the two angles adding up to 180º. Interesting stuff!

-Kristin

Volume and Minecraft

We continued our work today reasoning about a prism’s dimensions when a volume is doubled. Instead of using our unit cubes, I thought the blocks in Minecraft would work and give students a visual of what is happening to the dimensions when we make a prism twice as big.

I first asked them to build a prism that was a 2 x 3 x 5 (of course I got this one….his sign reads “Math Man”) 🙂

IMG_7773_2

Then I asked them to double their prism by adding onto their original and we recorded their new dimensions.

IMG_7774_2IMG_7775_2IMG_7777_2IMG_7776_2

Then we tripled the original and recorded the dimensions.

IMG_7779_2IMG_7778_2

IMG_7793_2

Then they jotted down other dimensions they thought would work and we looked for patterns in doubling or tripling a volume.

IMG_7799_2IMG_7798IMG_7797IMG_7796_2IMG_7794_2

And then some students tried starting with another original to see if it always works….

Photo Oct 23, 12 45 03 PMPhoto Oct 23, 12 39 31 PM

-Kristin

Volume Student Work…

So, I couldn’t resist the urge to blog about my students’ first day of work with volume since I had posted the other day about my planning,even though I have tons of other things that need to get done. We are sharing their work tomorrow to elicit strategies and make connections. With the 5 Practices in mind, I am heading off to sequence the shared work to make those connections.Tons of things to work with here!

As always, I love your thoughts on the order and items you would share!

IMG_7741 IMG_7742 IMG_7743IMG_7746IMG_7745IMG_7744    IMG_7747 IMG_7748 IMG_7749 IMG_7750 IMG_7751 IMG_7752

FOLLOW UP – For homework, I had the students try to generalize a strategy for finding the volume of any box and here are a few that I got and plan to build upon…

IMG_7768IMG_7761IMG_7760IMG_7759IMG_7758