I have been meaning to follow up on this post for over a month now!
Over the first 6 slides, we saw so much great confusion when they were trying to figure out how to name the location of the point. We saw some students use measurements from the top and bottom of the screen, while others tried using some fractions. To get a picture of how students’ thinking changed from one grid to the next, I copied their responses from Desmos to this table in Google. In the table, each row is the same student’s response to describing the point location on each of the three different grids.
During the activity, we paused the students after the 6th slide and asked some volunteers to read their directions. After a few misses due to the fact they didn’t name a starting place or they counted squares instead of lines, we asked them to try re-writing some directions on the back of their paper.


We could tell they were finding the axes pretty necessary so after plotting the point successfully a few times as a class, we gave them some of the terminology and conventions for plotting and naming points in a coordinate plane.
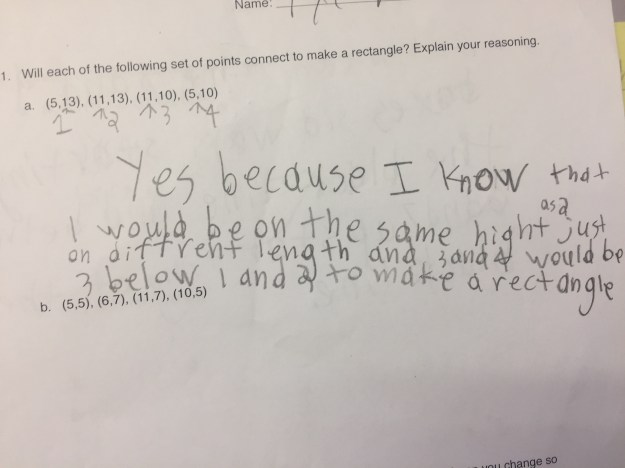
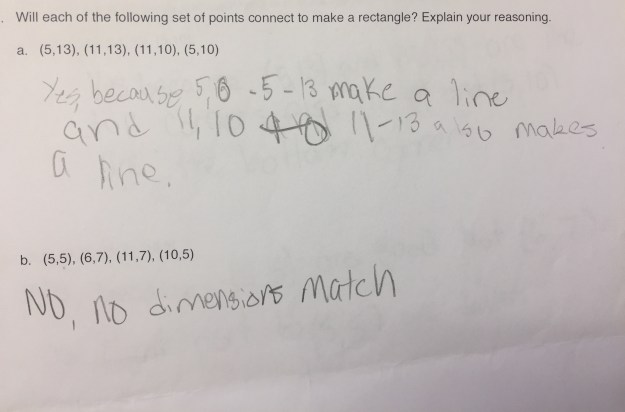
This is the place where we thought we may run out of time but we wanted to give them a chance to plot some points that formed rectangles and look for patterns in the coordinates. I copied the things they noticed at the bottom of this table.
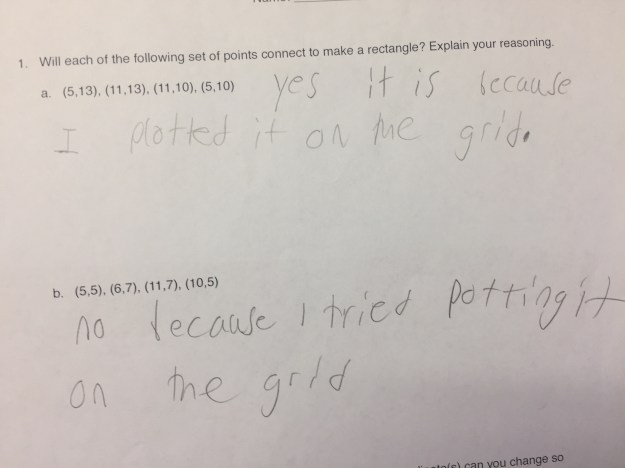
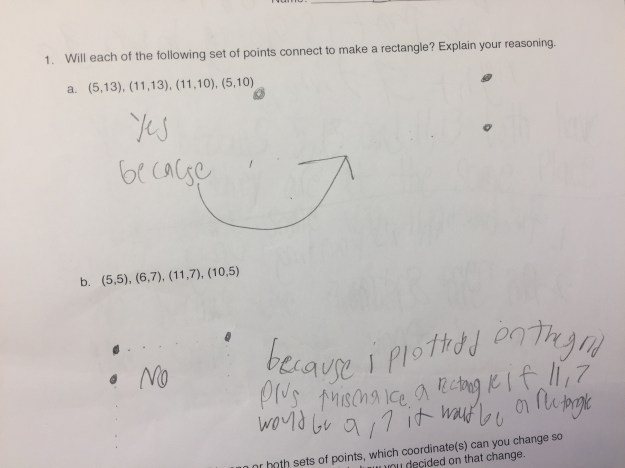
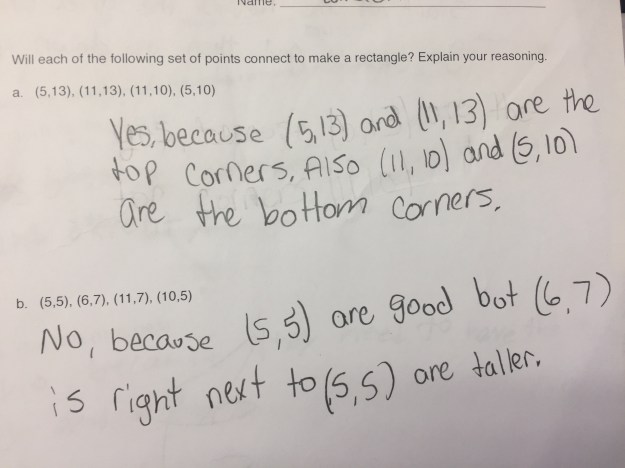
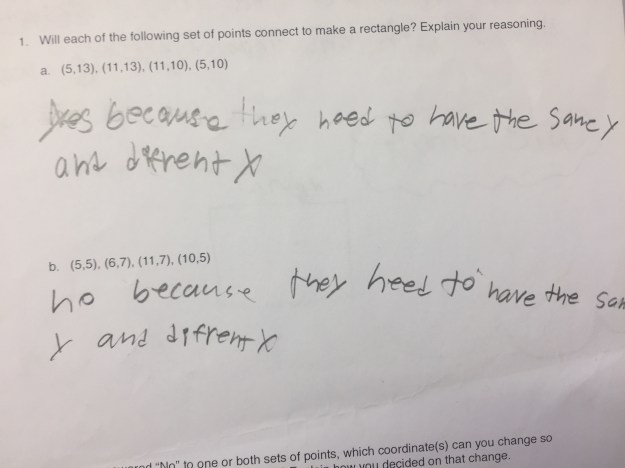
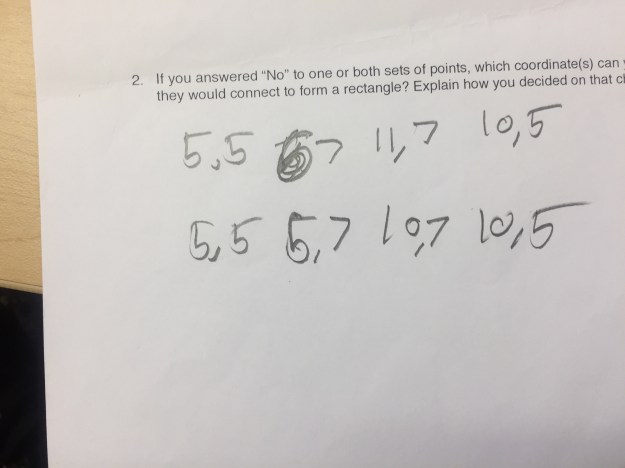
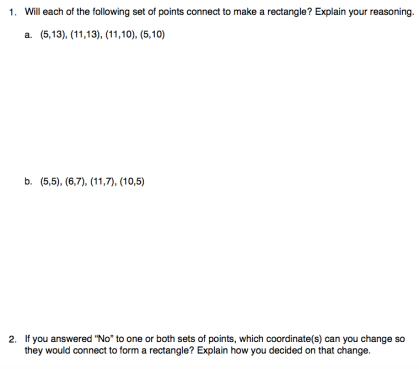
If they finished the work with their partner in Desmos, we asked them to complete two final questions about points that would connect to form a rectangle. We wanted to get a picture of which students were graphing them to find out and which were using what they noticed about the x- and y-coordinates. We knew this may be a stretch with some, given the amount of time we had in the class period, but I am always way to curious not to ask! Leigh was revisiting this work over the course of the next few days, so we were in no hurry to expect mastery at this point. It was great to see the mix of thinking about this: