Category Archives: Data

Slow Reveal Graph / Problem Posing Mashup

I have always loved, loved, loved Jenna’s Slow Reveal Graphs! They provide such an engaging structure that encourages students to explore and reason about data. If you don’t know what Slow Reveal Graphs are, it might be helpful to read up on them here before continuing.

Sense-making is so front and center in a slow reveal activity that I think it could be interesting and exciting to extend this activity with problem posing! I have been learned so much about problem posing from my friend Jinfa Cai. Problem posing is an instructional approach in which students generate and solve their own mathematical problems. In doing so, students share mathematical authority in the classroom and position students as creators of mathematical inquiry rather than solely recipients. I wrote a bit about it in the new NCTM book, Teaching Mathematics Through Problem Solving (pg 73-74).

The Mashup

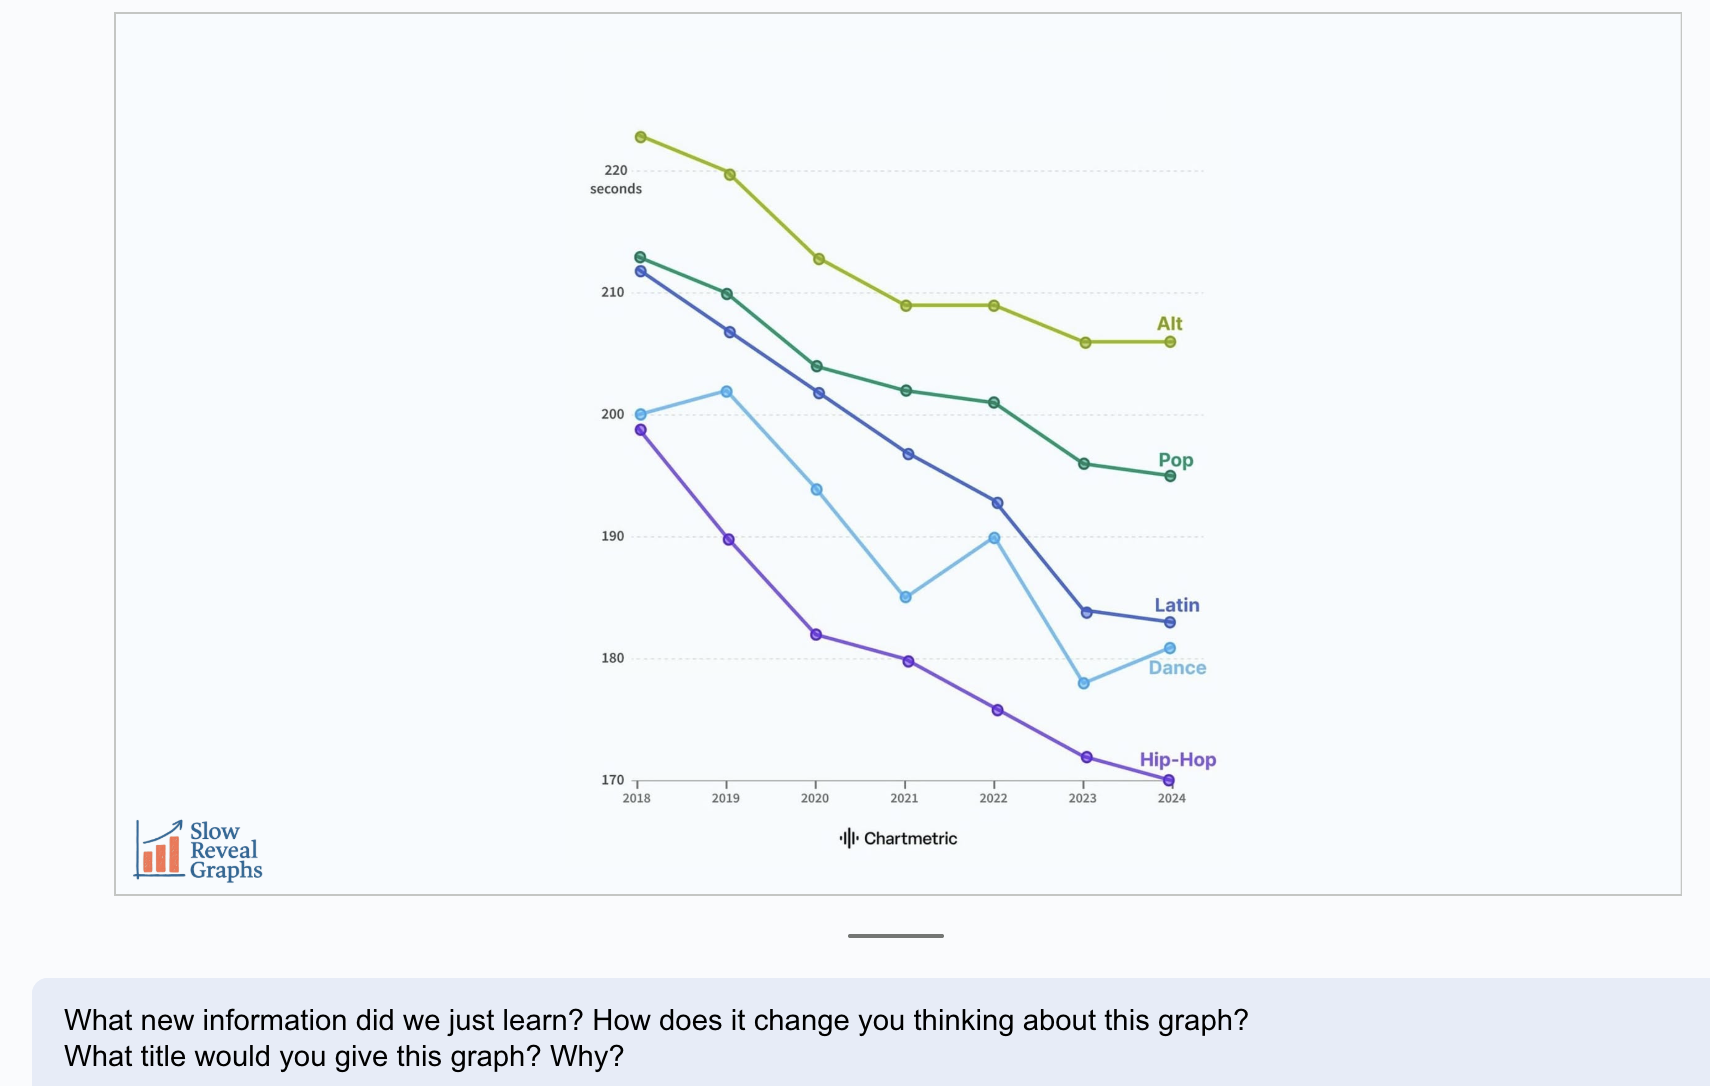
To think about what a mashup could look like, let’s go check out one of Jenna’s recent slow reveal graphs, Average Song Length by Genre. Which is so appropriate because Jenna and I love to chat 90’s hip hop artists;) Oh, and did I mention that Jenna creates a slide deck with notes for each one of these?!?

Step 1: Display the graph and ask students what they notice and wonder. (Slide 1)

Step 2: Display the graph with new information, ask questions that encourage students to interpret the new information, and make predictions about what is still missing…luckily, these directions are in the slide notes of Jenna’s slides. (Slides 2-3)

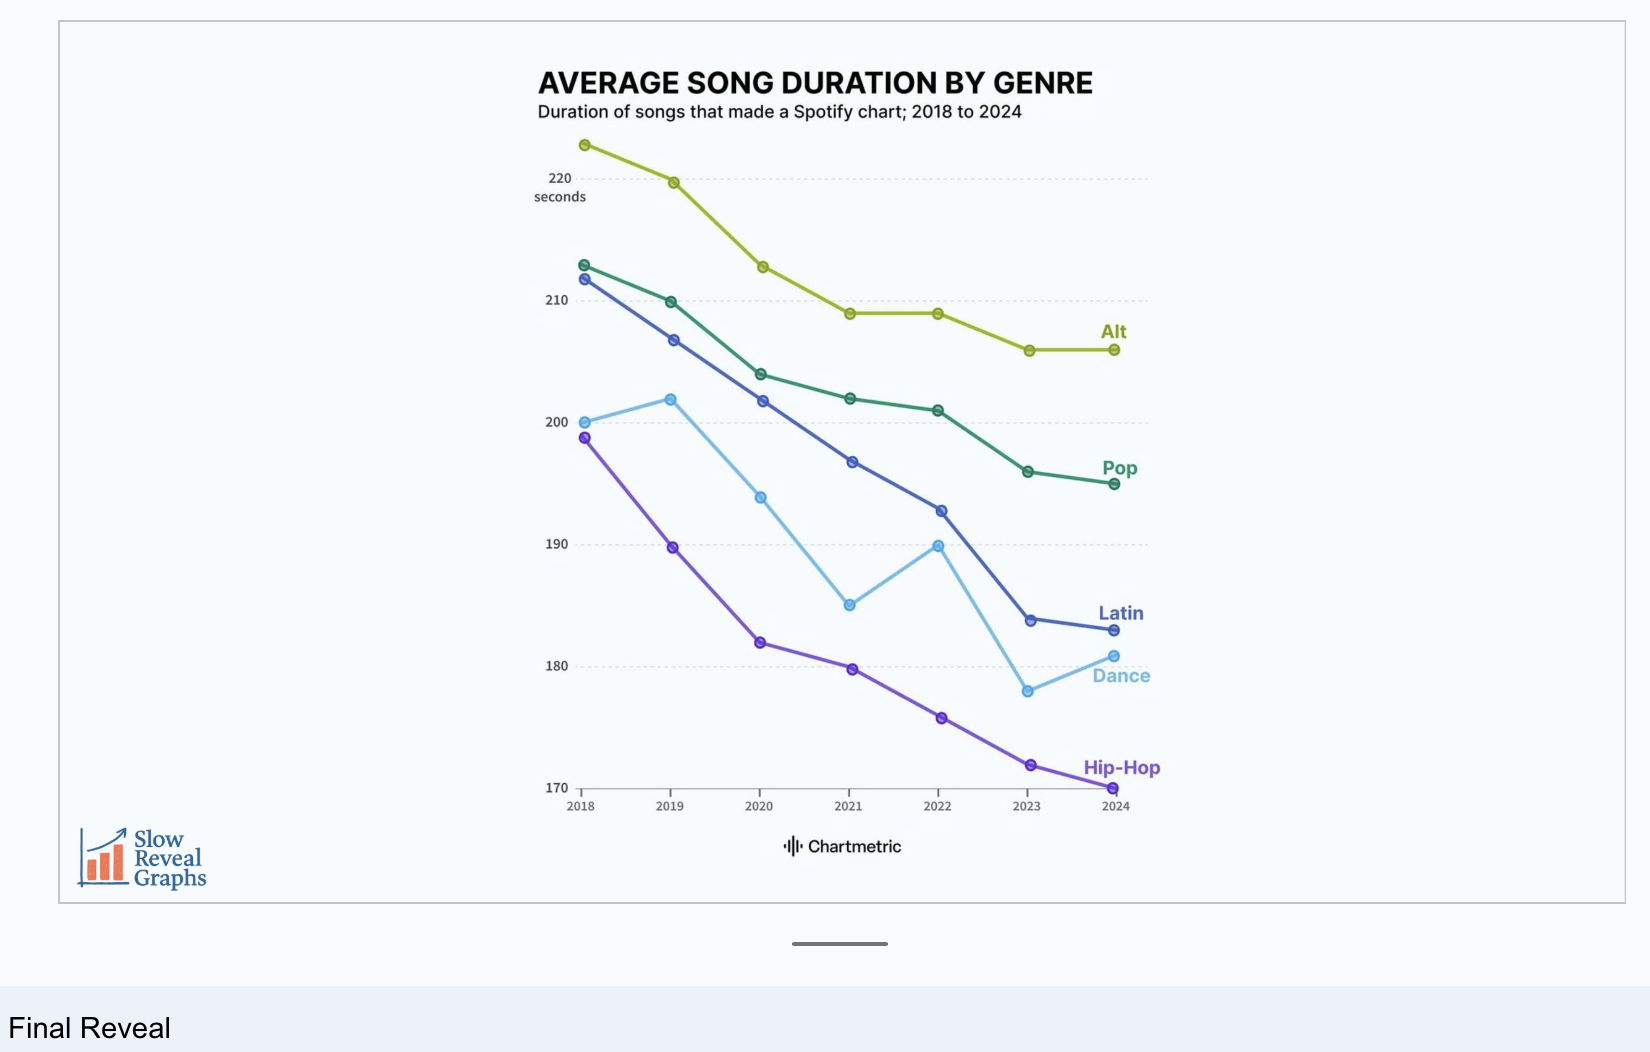
Step 3: Display the final reveal of the graph. (Slide 4)

Step 4: Problem posing: Ask students to pose problems that can be answered by information in the graph and record them on a piece of chart paper.

Students might pose many different types of problems such as:

  1. Which genre had the longest average song in 2019?
  2. About how much longer was the average latin song than hip-hop song in 2023?
  3. About how much did the average pop song duration decrease from 2019 to 2024?
  4. Which genre had an increase in average song duration? Between what years?
  5. If you listened to a dance song and alternative song in 2022, about how many seconds would you be listening? How many minutes?

This list could go on and on, but you get the point. I know it could be nerve-racking to use a graph like this because there are not definite values at every point, but I think that actually increases the reasoning element and could raise some cool points for argumentation!

Step 5: Ask students to solve their problems.

This is a choose your own adventure — you could ask students to solve all of the generated problems or you could focus attention on one or two problems aligned to that day’s learning goal. I always lean toward the latter so the activity isn’t just a one-off random activity, but instead connected to what they are learning. This also leaves me a bank of ‘if you get done early‘ problems, which was always one of the biggest differentiation challenges for me, and helps me focus the whole group discussion afterwards.

Step 6: Synthesize the learning.

This step is really dependent on the learning goal of the day. After solving, you could have students do a gallery walk to compare solutions and solution methods, representations, and reasoning. Or you could decide to have a whole group discussion based on the monitoring that you did as students worked.

I have always been such a fan of numberless word problems, notice/wonder, and the 3 Reads MLR. Problem-posing feels like it pulls the most purposeful parts of each of these routines into one. Layering problem posing on Jenna’s slow reveal structure puts such an fantastic focus on data while also supporting other areas of mathematical focus. It is also so adaptable by grade level, which makes it so flexible!

Final Problem Posing Thoughts

When students have the opportunity to pose their own mathematical problems based on a situation, they must make sense of the constraints and conditions from the given information to build connections between their existing understanding and a new understanding of related mathematical ideas (Cai, 2022). And when teachers have the opportunity to listen to connections students make, understand the math students see in situations, and make teaching decisions on how to elicit, share, and move forward with student thinking, it shares the mathematical authority in the classroom and leads to deeper, more powerful learning for all!

I have blogged a bit about problem-posing if you are interested in learning more: https://kgmathminds.com/2023/09/23/embedding-problem-posing-in-curriculum-materials/ and https://kgmathminds.com/2023/05/06/problem-posing-fun-in-fourth/.

Sorting Data in 2nd Grade

Today, I met the Yekttis.

While our intention today was to plan for the lesson after these crazy, fabled, Investigations characters, this activity quickly became the center of our conversation. It seemed the more we talked, the more tangled we got in our own thinking around the math itself, in addition to how to pose the activity to students and what questions to ask as they sorted. It felt like wording was a big deal here. How were we using the words: attribute, category, rule? Were they interchangeable? Would they make a difference in the way student thought about it? Do they make a difference in how we think about it? What is this mathematically and where is it going? While I was planning with three other teachers, only one of the teachers had taught this lesson before and she expressed how difficult it was for students once they were asked to sort based on two rules. We were ready to rethink the whole thing and kept asking ourselves if it was worth what the students would get out of it. But, because of all the questions and confusion in our own thinking, we were really intrigued to see how students would think about it.

Feeling a little like I jumped into the middle of a series of lessons, the teachers were great about filling me in on the students’ work prior to this activity. They had played a game called “Guess My Rule” which I was knew from 5th grade. In this activity, the teacher secretly chooses a rule, points out a few students who fit the rule, others who do not, and students try to guess the rule used to sort. They were really successful with this and enjoyed it.

Now, enter the Yekttis. They are a bunch of cards like the ones above. They have different shaped faces, eyes, and antennae. We decided to give them some time to play with the Yektti cards today and ask them how we could sort the Yekttis. I am hoping Tara, Lauren, and Kristin comment on here so they can go into depth about what the students did because I had to be 5th grade while they taught this lesson. When I caught up with Lauren toward the end of the day to recap, she noticed that the students, at first, looked at sorting as organizing the Yekttis in patterns rather than by attributes. They finally got to what attributes they could use, but when asked if they could sort based on a second rule, they were stumped. They could say “has this, but not this” type of sorts, but were seeing that as two rules because they were creating two groups…the haves and the have nots. As her and I talked, we realized how difficult it was to ask students to sort by two rules vs only one.

Since I left school, I have been thinking about this and have reread the lesson (I will post that at the bottom, after my questions). To me, it feels really difficult for students to sort by two rules and create a Venn diagram based on that sort. Choosing the categories is the stickies part because up until this point, they have experience only choosing categories that are mutually exclusive.

I find the really cool part of this whole thing is students realizing what categories will have an overlap versus those that will not. For this reason, I don’t want to walk students through this, but I feel there are some questions to ask in the process that could be pretty important. This is where I am struggling. What do I ask that does not put the answer right in from of them or become just another process of representing data. My thought for tomorrow is to play Guess My Rule with the Yektiis. Put a few Yektti cards inside and outside of the circle and ask students what the rule could be.  Once they guess the rule, I will label the circle and place the rest of the cards accordingly. Next, and this is the question I don’t know is the right one, I will ask “Is there another rule we can use to sort the Yekttis in our circle?” For example, I could choose “Has a Square Face” as my rule, we sort by placing all of the square faces in the circle and the others out. Now, let’s say the students say our second rule could be, “Has two antennae.” How do we proceed from here? Do I draw in the second circle that overlaps? Do I ask if the circles will overlap? Why does it then feel weird to then pull cards that were once outside of the circle back into the new circle?

After coming up this idea, I looked at the book to realize they handle it quite differently:

Screen Shot 2016-01-05 at 6.20.31 PM

I don’t know how I feel about this and need to re-read it in the morning when I am not also thinking about a 3rd and 5th grade lesson for tomorrow! I feel it takes a bit of the “sorting power” out of the students hands? I would love any thoughts on this!